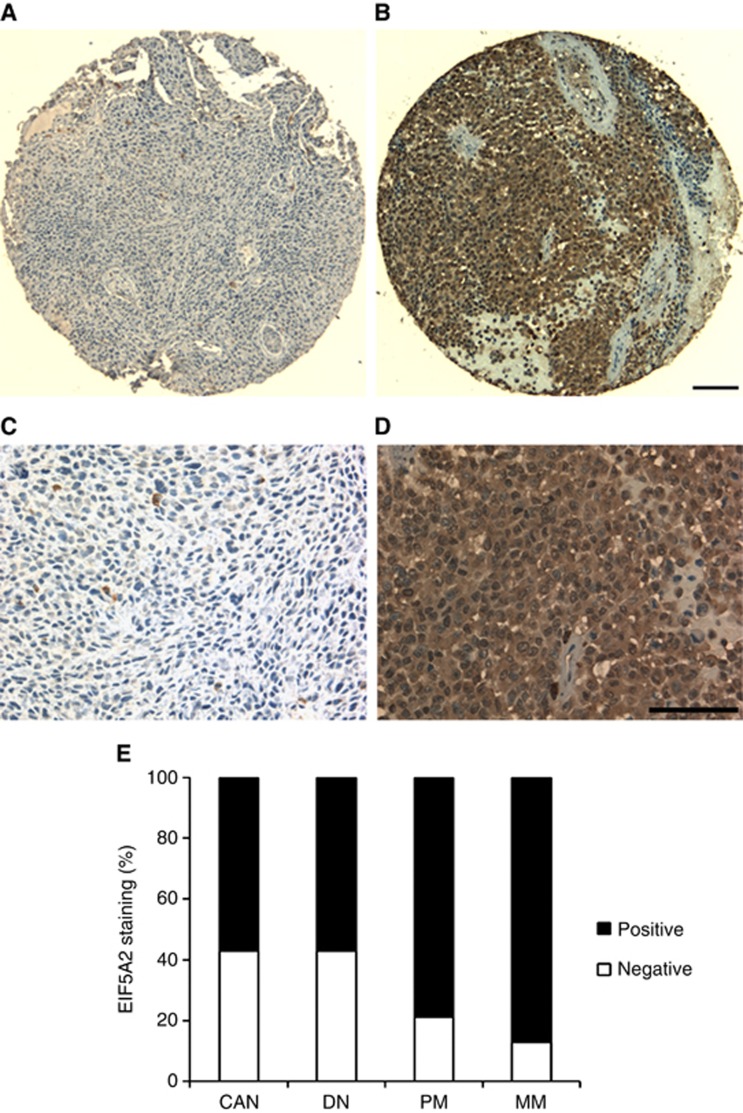
Figure 1.
EIF5A2 expression in CAN, DN, PMs and MMs. (A and C) CAN with negative EIF5A2 staining. (B and D) MM with positive EIF5A2 staining. Bar=100 μm. (E) Positive EIF5A2 expression is increased in MMs compared with CAN (P<0.001), DN (P<0.001), and PMs (P=0.044). Positive EIF5A2 expression is increased in PMs compared with CAN (P=0.009) and DN (P=0.001).

