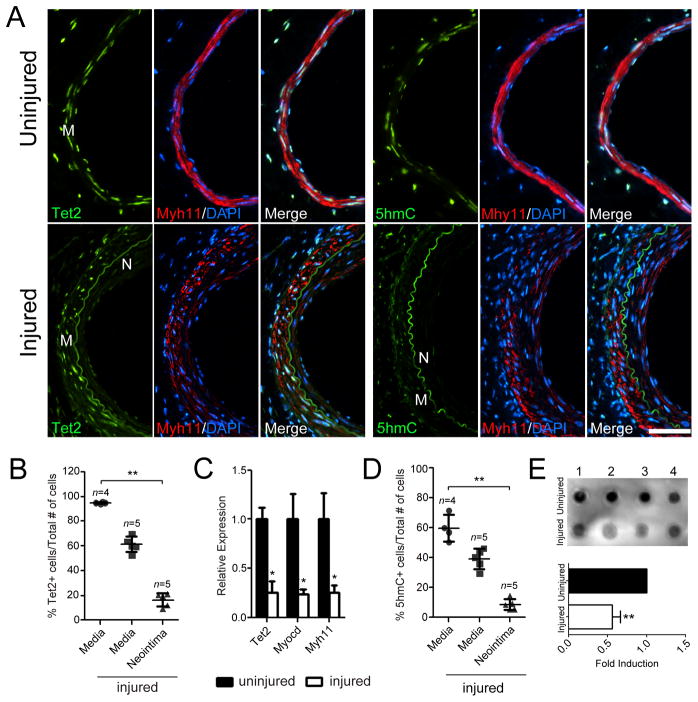
Figure 2.
TET2 is downregulated during vascular injury. (A) TET2 and 5-hmC immunostaining of cross-sections from uninjured contralateral control mouse femoral arteries (top row) or injured femoral arteries (bottom row) collected 3 weeks following wire injury. Nuclei are stained with DAPI. (B) Quantification of TET2 positive cells divided by total number of DAPI positive cells in the uninjured (n=4) compared to injured (n=5) mouse femoral arteries. **P<0.01 relative to uninjured media. (C) qPCR for Tet2, Myocd and Myh11 gene expression in uninjured compared to injured femoral arteries 3 weeks post-injury. RNA was isolated from media and neointima from sections on slides using the Pinpoint isolation system. The adventitia was removed to ensure that only the media and neointima were used for analysis. *P<0.05 relative to uninjured arteries. (D) Quantification of 5-hmC positive cells divided by total number of DAPI positive cells in the uninjured (n=4) versus injured (n=5) femoral arteries. **P<0.01 relative to uninjured media. (E) Dot blot for global 5-hmC levels of uninjured and injured samples (n=4). Genomic DNA was isolated from tissue sections using the Pinpoint isolation system as in (C). Fold induction levels were calculated based on pixel intensity using Image Lab Software (**P<0.01). M = media, N = neointima. Scale bar, 50 μm. Error bars represent mean ± SD. n represent the number of individual mice. Two or more slides (12–18 sections) per animal were used for analysis.

