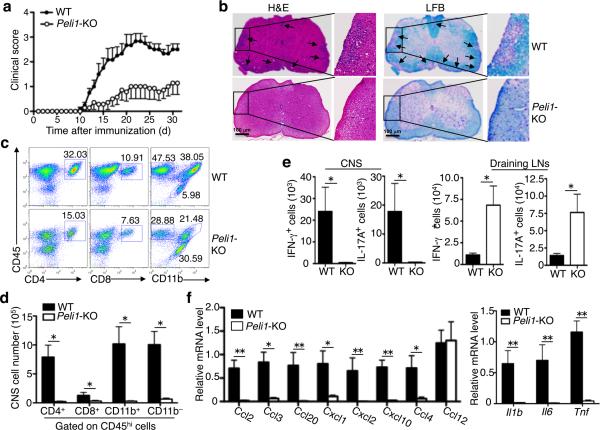
Figure 1. Peli1-KO mice are resistant to EAE induction.
(a) Mean clinical scores of age- and sex-matched wild-type (WT) and Peli1-KO mice subjected for MOG35-55-induced EAE (n=5/group). (b) H&E and Luxol Fast Blue (LFB) staining of spinal cord sections from MOG35-55-immunized wild-type and Peli1-KO EAE mice for visualizing immune cell infiltration and demyelinization, respectively (arrows). Scale bar, 100 μm. (c,d) Flow cytometry analysis of immune cell infiltration into the CNS (brain and spinal cord) of MOG35-55-immunized wild-type and Peli1-KO mice (n = 5, day 15 post-immunization). Data are presented as a representative plot (c) and summary graph (d). (e) Absolute number of Th1 and Th17 cells in the CNS (brain and spinal cord) and draining LNs of MOG35-55-immunized wild-type and Peli1-KO mice quantified by flow cytometry (n = 4, day 15 post-immunization). Data are presented as summary graphs. (f) QPCR analysis to determine the relative mRNA expression level of genes encoding chemokines (left panel) and proinflammatory cytokines (right panel) in spinal cords of MOG35-55-immunized wild-type and Peli1-KO mice (n = 4, day 15 post-immunization). Data were normalized to a reference gene, β-actin. *P<0.05 and **P<0.01.

