
Figure 1. Expression of MDN1 alleles fluctuate independently over time.
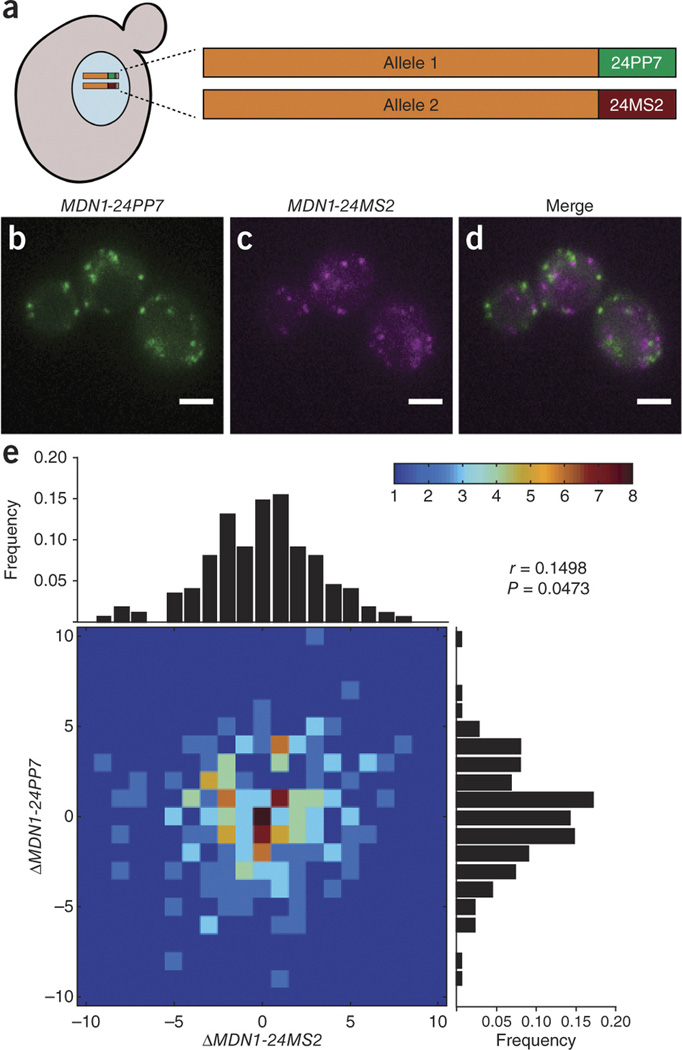
(a) A diploid strain carries one PP7-tagged MDN1 allele and one MS2-tagged MDN1 allele. Coexpression of PCP-2yEGFP and MCP-mCherry results in allele-specific labeling of mRNA. (b,c) Transcription of the indicated allele produces green or magenta fluorescent spots. (d) Overlay of mRNA fluorescence for both alleles. (e) MDN1 mRNAs are counted in single cells every 20 min. Fluctuations were determined as the change in steady-state levels for a given allele between time points, and a heat map was generated to represent these fluctuations. Peripheral histograms represent the distribution of fluctuations for each allele. Pearson's correlation coefficient (r) is generated from the data set (P = 0.0473, n = 210 time points in 33 cells). Scale bars, 3 µm.