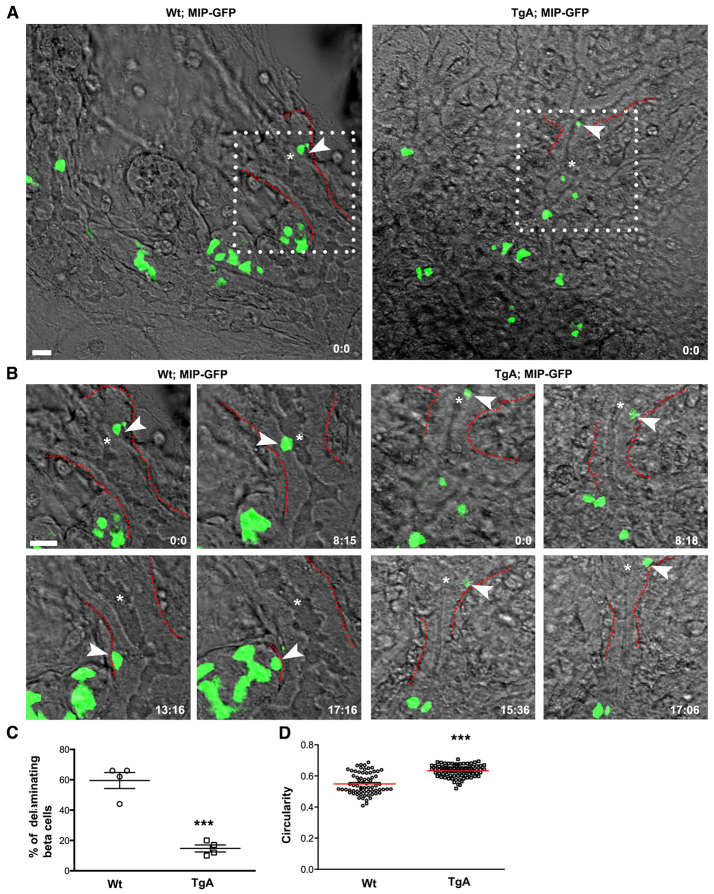
Fig. 3.
Time-lapse imaging reveals impaired delamination of Ins+ cells expressing caCdc42. Dorsal pancreatic explants from Wt; MIPGFP and TgA; MIPGFP were cultured and imaged for ∼17 hours. Fluorescence and differential interference contrast images were sequentially captured every 15 minutes using z-stacks (35-50 μm) with an interval of 1-2 μm. The images are maximum intensity projections covering the entire sample height of 30-50 μm. (A) Snapshot at time 0, indicating the position of Ins+ cells (green) relative to epithelial and mesenchymal components. White boxes indicate regions that were further analyzed using time-lapse movies (shown in B) [supplementary material Movies 1 (Wt) and 2 (TgA)]. (B) The movement of individual Wt (left) and Tg (right) Ins+ cells (arrowheads) was tracked over time and representative snapshots at indicated time points (hours: minutes) are shown. Compared with Wt, TgA Ins+ cell movement was markedly restricted and the cell fails to delaminate. The dotted lines (red) in A and B mark the basal boundary of the epithelium. Asterisks in A and B indicate lumen. (C) Quantification of delaminating β cells (single cells as indicated with arrowhead in A) in Wt and TgA. Delamination of β cells is significantly reduced in the TgA background (59.5% in Wt versus 14.75% in TgA; ***P=0.0002). Four movies from each genotype were analyzed. Error bars represent s.e.m. (D) Maximum intensity projections compiled from all z-stacks were analyzed for changes in cell shape over time using circularity as parameter; a value of one indicates a perfect circle. The average circularity of TgA cells was higher than in Wt cells. Each value in the graph represents average circularity of all Ins+ cells at a given time point [n represents time points: Wt (70) and TgA (83), ***P<0.0001]. The red lines indicate the mean values. Scale bars: 20 μm.

