Fig. 4.
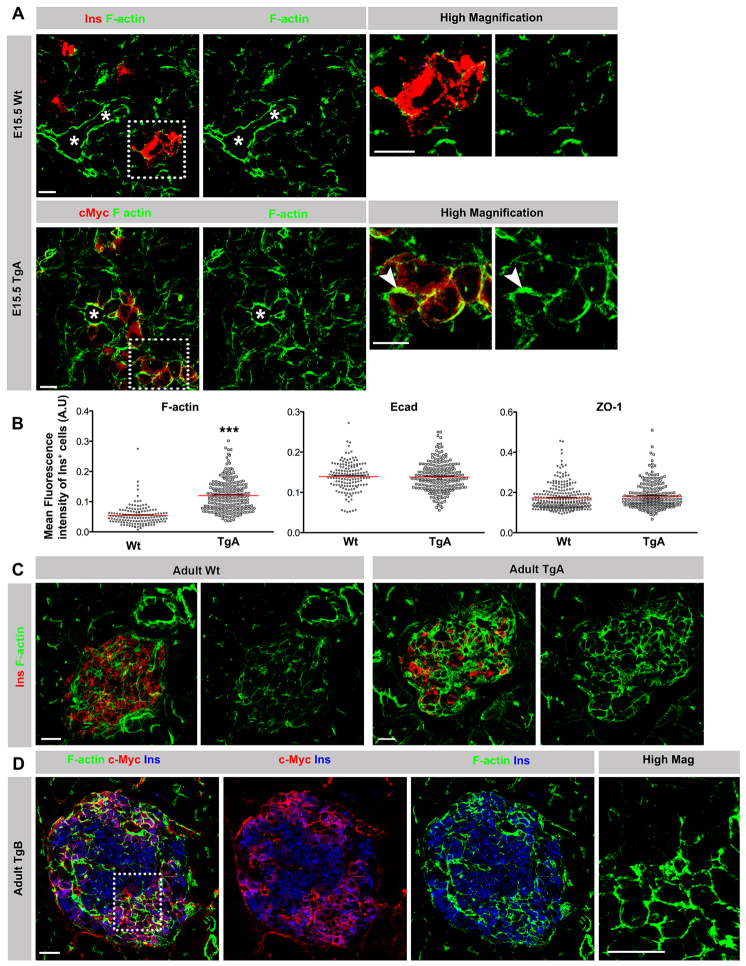
Impaired cell-cell junction disassembly in caCdc42 β cells. (A) E15.5 pancreas sections from Wt and TgA immunostained with antibodies against insulin (Ins; red) or c-Myc (red) in combination with F-actin (green). In comparison to Wt β cells, TgA β cells showed enhanced cortical F-actin at cell-cell junctions (arrowheads). Asterisks indicate lumens. Dotted boxes indicate the regions shown in high magnification images. (B) Quantification of the mean fluorescence intensity of F-actin, Ecad and ZO-1 immunostainings in E15.5 Ins+ cells revealed a significant increase of F-actin intensity in TgA Ins+ cells compared with Wt, whereas E-cadherin and ZO-1 remained unchanged. n represents the number of Ins+ cells: F-actin and Ecad, n=148 (Wt) and 217 (TgA), ***P<0.0001 (F-actin) and P=0.7345 (Ecad); ZO-1, n=264 (Wt) and 228 (TgA), P=0.1140. The red lines indicate the mean values. (C) Double immunostaining of sections from 5-week-old Wt and TgA pancreata with antibodies against F-actin (green) and Ins (red). Cortical F-actin levels were increased in all TgA Ins+ cells compared with Wt Ins+ cells. (D) Triple immunostaining of sections from 5-week-old TgB pancreas with antibodies against F-actin (green), c-Myc (red) and Ins (blue). TgB β cells exhibit increased levels of cortical F-actin at cell-cell contacts (c-Myc+Ins+) in comparison with Wt cells (c-Myc-Ins+). Dotted box indicates the region shown in high magnification image. Error bars represent s.e.m. The images are maximum intensity projections covering 10 μm. Scale bars: 10 μm (A,C,D).

