Fig. 6.
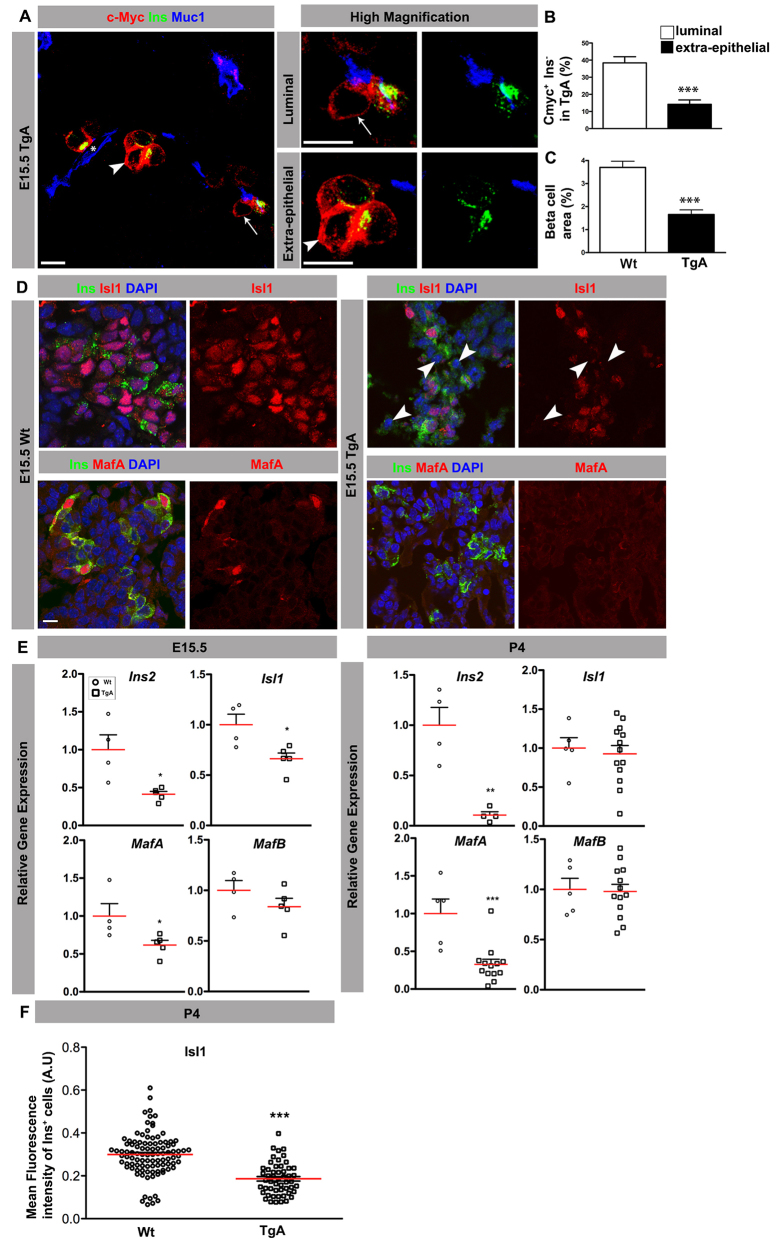
Expression of caCdc42 results in deficient β cell differentiation. (A) Triple immunostaining of sections from E15.5 TgA pancreas with antibodies against c-Myc (red), Ins (green) and Muc1 (blue). In a fraction of the c-Myc+ cells, insulin is undetectable (c-Myc+Ins- cells). Ins- cells were observed in both c-Myc+ cells facing the lumen (luminal; arrows) and not facing the lumen (extra-epithelial; arrowheads). The indicated cells are magnified in the adjacent panels. (B) The fraction of c-Myc+Ins- cells facing the lumen (luminal) and not facing the lumen (extra-epithelial) was estimated by counting the total number of c-Myc+ cells and the number of luminal and extra-epithelial c-Myc+Ins- cells. Loss of insulin expression was more evident in cells facing the lumen (n=5, ***P=0.0006). (C) E15.5 serial sections covering the entire pancreas were stained with Ins and Ecad antibodies. The Ins+ cell area was calculated (Axiovision, Zeiss) by dividing the cross-sectional areas of β cells (Ins area) with the total pancreatic epithelium (Ecad area). The Ins+ cell area is reduced in TgA mice (n=4, ***P=0.0009). (D) Sections from E15.5 Wt and TgA pancreas were immunostained with antibodies against Ins (green), Isl1 (red, upper panel), MafA (red, lower panel) and DAPI (blue). In contrast to Wt, Isl1 expression was strongly reduced in TgA Ins+ cells (arrowheads). MafA is lost in all TgA Ins+ cells. (E) Q-PCR analysis of E15.5 (left) and P4 (right) Wt and TgA pancreata showed a decrease in the relative expression of Ins2 (P=0.0128), Isl1 (P=0.02) and MafA (P=0.0475), whereas MafB (P=0.2447) was unaffected at E15.5 (Wt, n=4; TgA, n=5). At P4, relative expressions of Ins2 (P=0.0026) and MafA (P=0.0006) were decreased whereas MafB (P=0.8791) and Isl1 (P=0.7083) were unaffected (Wt, n=5, for Ins2 n=4; TgA, n=13, for Ins2 n=4). (F) Quantification of the mean fluorescence intensity of Isl1 and Ins double immunostaining at P4 revealed a significant decrease of Isl1 expression in TgA Ins+ cells compared with Wt. Three embryos for each genotype were quantified. n represents number of Ins+ cells: n=100 (Wt) and n=52 (TgA), ***P<0.0001. The red lines indicate mean values. The images are maximum intensity projections covering 10 μm. Scale bars: 10 μm.

