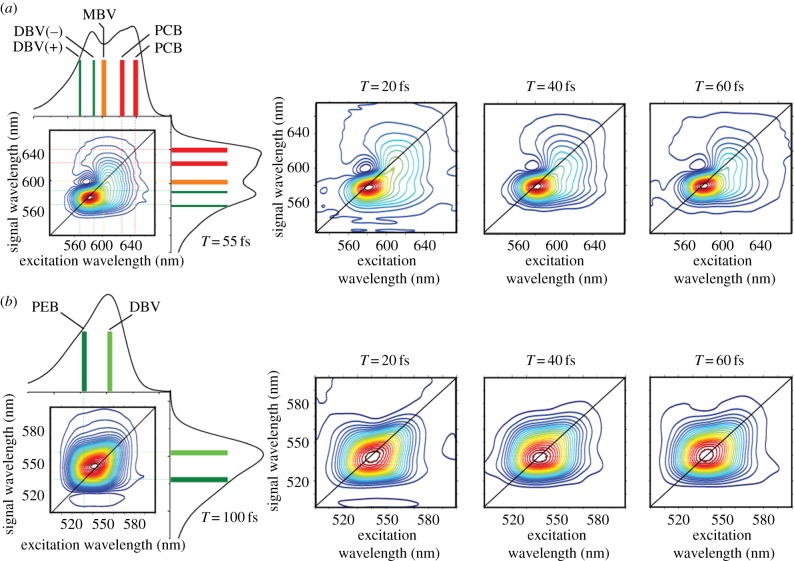
Figure 7.
Representative two-dimensional spectra of PC645 and PE555 plotted at various waiting times with corresponding linear absorption spectra shown alongside the T = 55 fs spectrum of PC645 and the T = 100 fs spectrum of PE555. The two-dimensional spectra are the real part of the total signal, plotted with 33 evenly spaced contours. The coloured bars in the linear spectra indicate locations of the estimated peak transition energies of individual components. (Adapted from Harrop et al. [145].)

