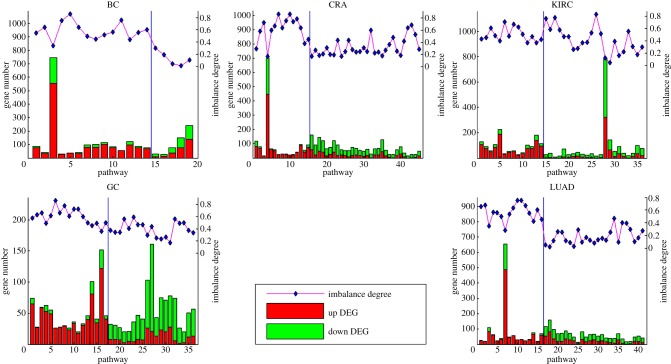
Figure 3.
Number of up- and downregulated genes in significant KEGG pathways. Only pathways that are detected as significant by analysing the up- or downregulated genes but missed by analysing all of the DE genes together are plotted on the x-axis. For each dataset, the bar plot shows the gene number in each pathway in the left y-axis. The corresponding imbalance degree of each pathway represented by filled diamond is shown in the right y-axis. The pathways detected by analysis of the upregulated genes are shown on the left of the vertical line, and the pathways detected by analysis of the downregulated genes are shown on the right of the vertical line. Abbreviations are same as in figure 2. (Online version in colour.)

