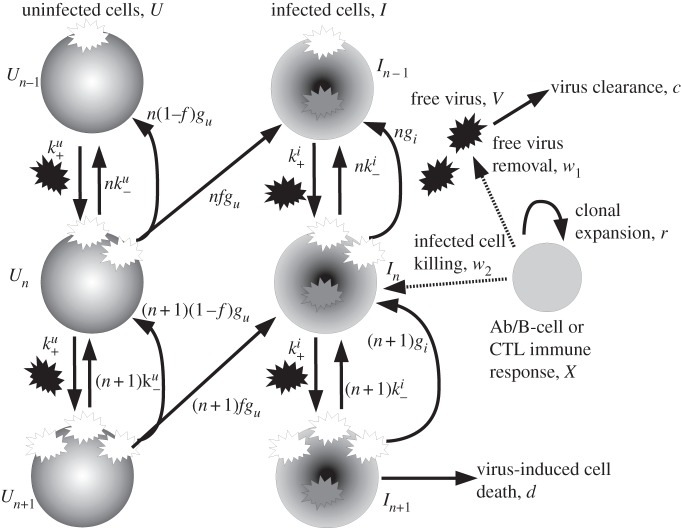
Figure 1.
Schematic of the model. The quantities being tracked are virus V, uninfected and infected cells with n virions bound to the surface, Un and In, and an immune response X, all expressed in particles per millilitre. Free virions (black) attach to uninfected cells at rate  or infected cells at rate
  The attachment is reversible, and detachment can occur at rates
  and
and  (the extra factors of n or n+1 in the flow rates account for multiple bound virions). Bound virions (white) are internalized into uninfected or infected cells at rates gu and gi. If an internalized virion (grey) enters an already infected cell, it does not alter the state of the infected cell. A fraction f of virions internalized into uninfected cells turn those cells into productively infected cells. Infected cells produce progeny virions at rate p, which are initially bound to the infected cell membrane (not drawn in the figure). The virions bound to infected cells can detach from the infected cells at rate
  to become free virions. Infected cells die and virions are cleared at fixed rates d and c, respectively. Also modelled is an adaptive immune response, which we consider a simplified representation of either a B cell/antibody or CD8+ CTL response. The immune response is described by a simple exponential growth term at rate r, corresponding to clonal expansion of T cells/B cells. The immune response is assumed to either clear free virions at a rate w1 (antibody/B-cell response) or kill infected cells at rate w2 (CTL response).

