
Figure 2.
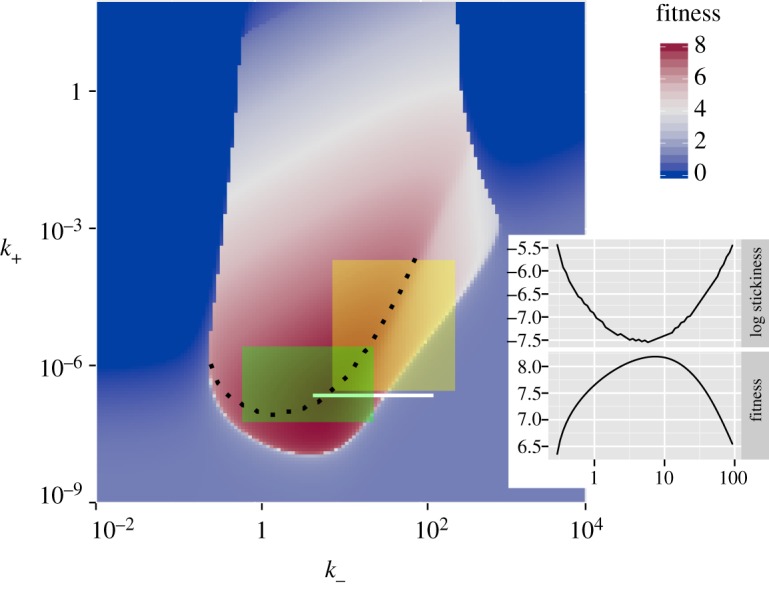
Virus fitness (equation (2.1)) as a function of the attachment and detachment rates k− and k+ (with k− in units of inverse days and k+ in units of millilitre over days). The three rectangles indicate ranges reported in three different experimental studies (see text). The inset shows a slice along the dotted high-fitness ridge line: for varying levels of k−, the level of stickiness (S = k+/k−) that optimizes fitness, and the level of fitness are plotted. In this scenario, no immune response is present (w1 = w2 = 0), we assumed all virions are infectious (f = 1) and attachment, detachment and internalization rates are the same for uninfected and infected cells  Other parameter values are as given in table 1. For plotting purposes, any values with fitness, F, below 0 were set to zero. (Online version in colour.)