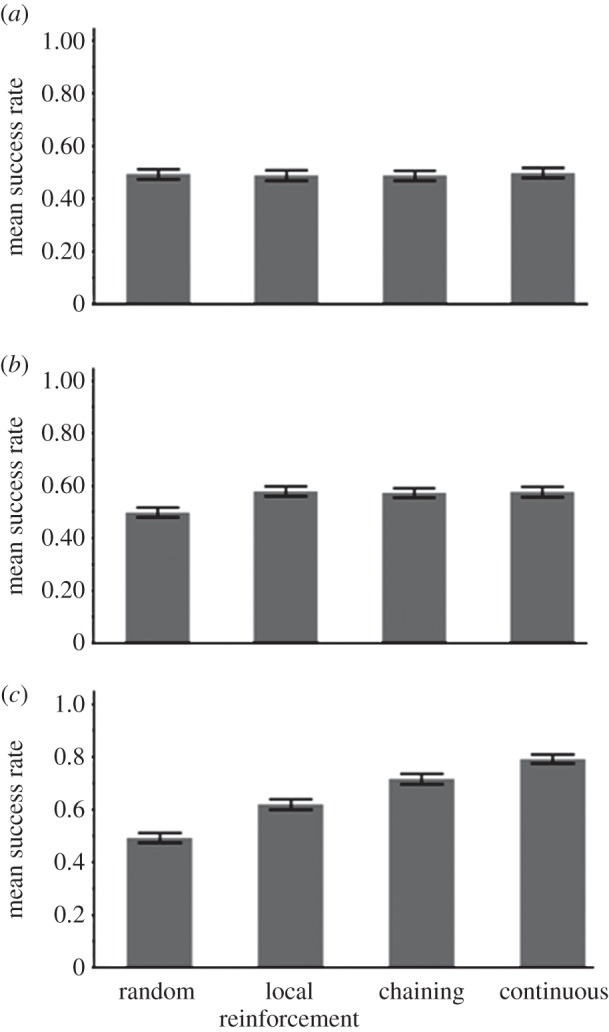
Figure 5.

The success rate of the three types of learners and a non-learner (random choice) in: (a) uniform environment (see related TP matrix in the electronic supplementary material, table T1), (b) environment with cues for finding food (see related TP matrix in the electronic supplementary material, table T2) and (c) patchy environment (see related TP matrix in the electronic supplementary material, table T3). Success rate was calculated as the total number of food items found in the 1000 chosen sequences out of the total number of food items in the test set (2000 sequences of four characters). The bars represent the means and 95% CIs over 500 runs.
