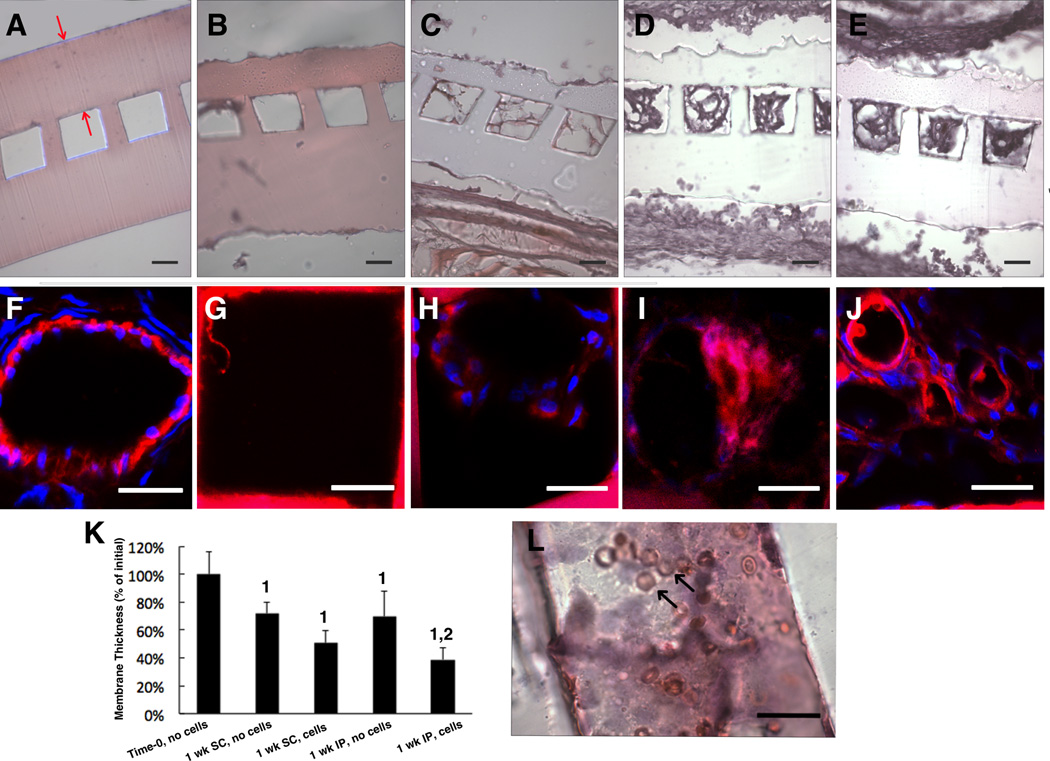
Figure 7.
Membrane biodegradation and microchannel vascularization in vivo. Initial (time-zero) implants are compared to explants in five groups: (A) Time-zero (B,C) one week subcutaneous (SC) explants without (B) or with (C) exogenous cells, (D,E) one week intraperitoneal (IP) explants without (D) or with exogenous (E,G) cells. (A-E,L) light micrographs of cross-sections (A-E) and a longitudinal section (L) stained with H&E. Confocal micrographs of a native blood vessel (F) and microvessels from SC scaffold without (G) or with (H) cells and IP scaffold without (I) and with (J) cells immunostained for anti-rat CD31. (K) membrane thickness expressed as % of initial; data are mean +/− SD. 1Significant effect of time; 2Significant effect of exogenous cells. (A) Red arrows show the membrane; (L) black arrows show red blood cells; (F–J) CD31 (and PGS) are red; cell nuclei are blue. Scale bars: (A–E) 50 µm; (G–L) 25 µm.

