
Figure 5.
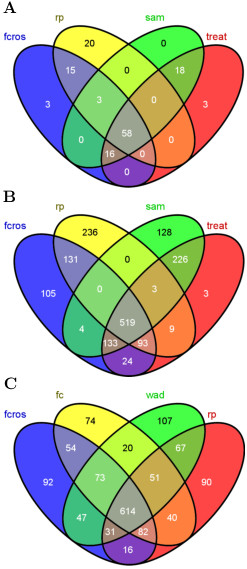
Comparison of the top seleted genes by different methods for the Colon and the Prostate datasets. Venn diagram of top seleted DE genes by the FCROS, RP, SAM and TREAT methods: (A) Colon and (B) Prostate datasets or by (C) the FCROS, FC, WAD and RP methods for the Prostate dataset.