
Figure 6.
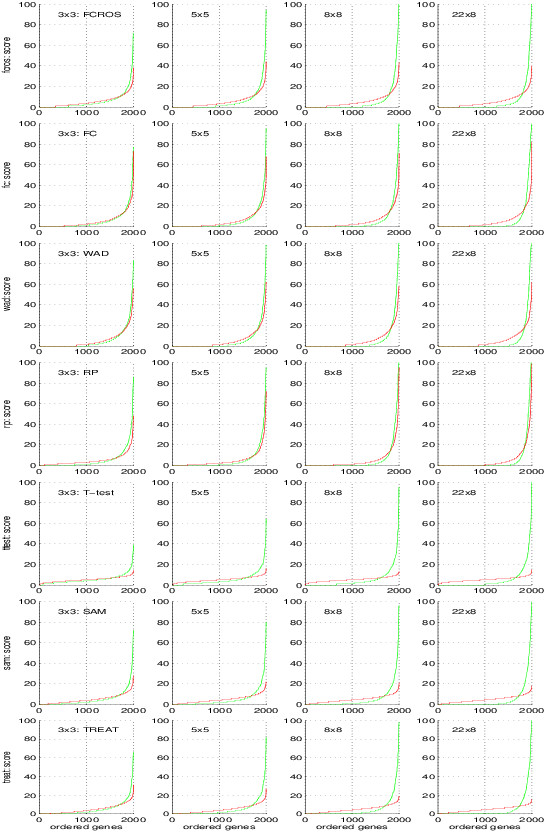
Impact of sample group size on the performance of the methods. Colon dataset, plot of scores obtained using the seven methods. Genes in the abscissa are ordered according to their score. The green line is used for the random selection of the control and the test samples from their true sample groups. The red line is used if no distinction was done between true sample groups during the selection of the control and the test samples.