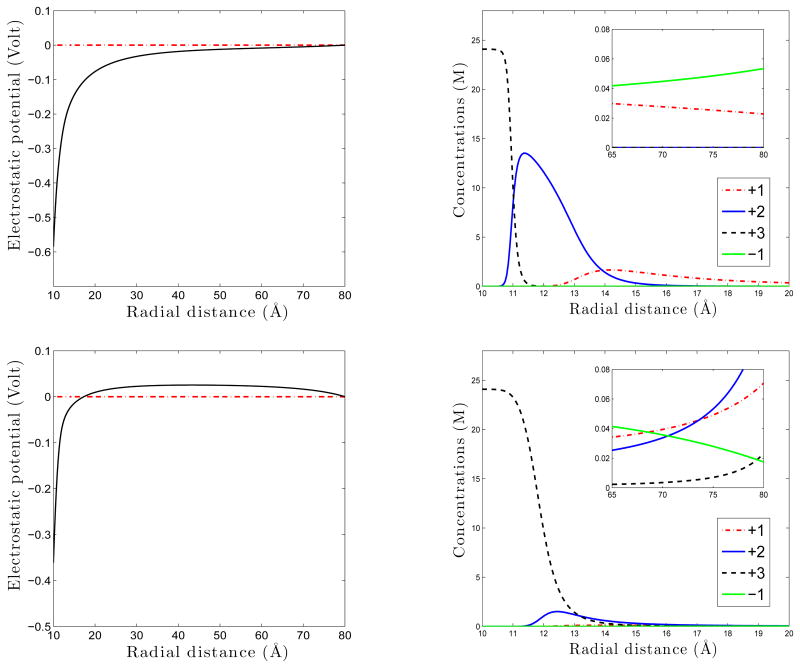
Figure 4.
The electrostatic potential ψ (left) and the equilibrium ionic concentrations (right). Top. Case I: (N1, N2, N3,N4) = (60,30,20,50), σ < 0, and σ∞ > 0. Bottom. Case II: (N1, N2, N3,N4) = (50,50,50,50), σ < 0, and σ∞ < 0. The concentrations profiles are marked by the corresponding ionic valences.

