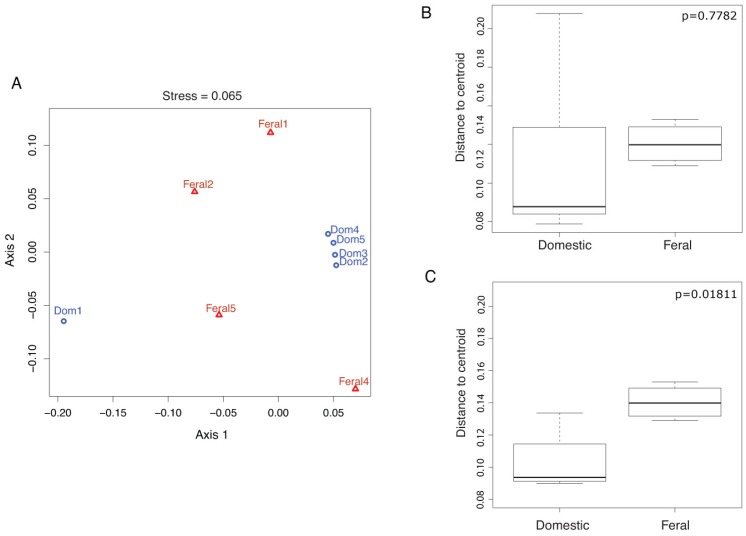
Figure 2.
Bacterial Community Structure. (A) Non-metric multidimensional scaling (NMDS) of community structure in feral and domesticated goats at the PhyloChip-OTU-level; blue circles represent the domestic animals, while red triangles represent feral goats. The stress value is presented as a metaMDS stress. (B) Analyses of dispersion for the communities within each animal group. (C) Analyses of dispersion for each goat group without the domestic outlier Dom1.

