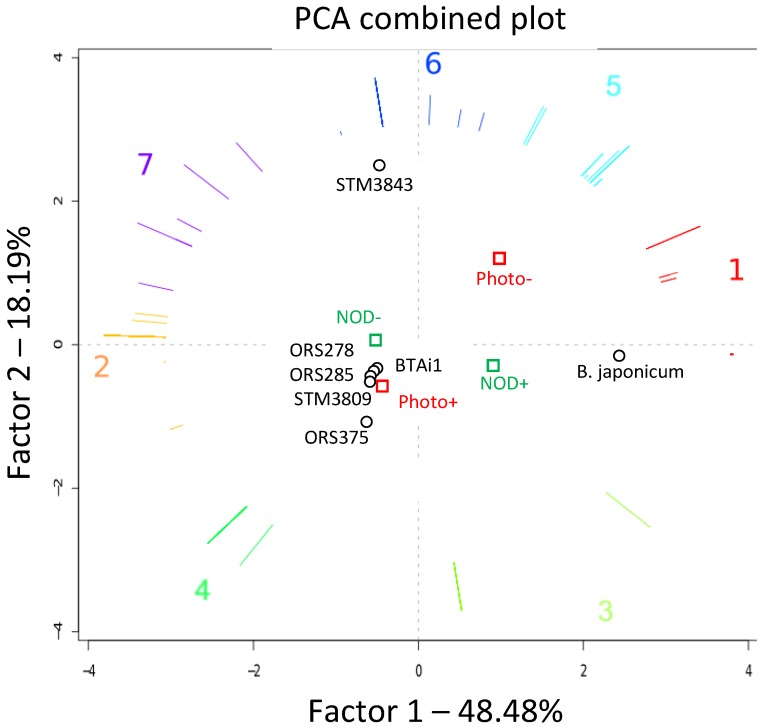
Figure 5.
Principal Component Analysis (PCA) of seven Bradyrhizobium genomes, performed on a two dimensional matrix compiling metabolic pathway completion values (the number of enzymatic reactions with coding genes for pathway x in a given organism, divided by the total number of reactions in pathway x as defined in the MetaCyc database; see Experimental Section) across all genomes. In the plot, each genome is represented by a point, whereas pathways are shown as colored vectors. Pathways with correlated completion values across organisms (vectors with similar orientation) have been clustered (corresponding to numbers 1 to 7) and drawn in the same color (vectors of pathways with identical completions overlap). Genomes can be associated with their representative and characteristic groups of metabolic pathways (i.e., vectors “pointing in their direction”). The corresponding pathway functions are listed in Supplementary Table S2. Vector length encodes the quality of representation of the pathway in the presented plot (i.e., the longer a vector is, the more representative its pathway is for genomes on the same side of the plot). Abbreviations: photo−/photo+: non-photosynthetic/photosynthetic strains; Nod+/Nod−: nod-dependent/nod-independent strains).

