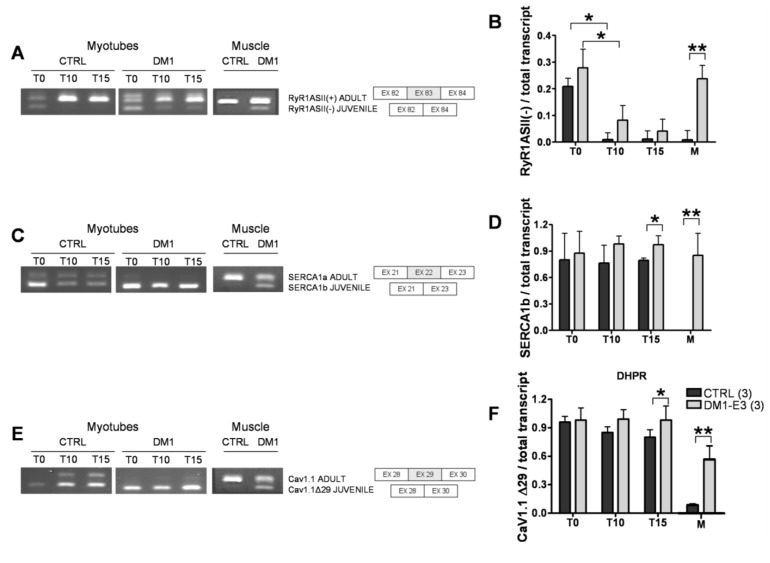
Figure 3.
Splicing patterns of Ca2+ channels and transporters in control and DM1 myotubes at 10 (T10) and 15 (T15) days of differentiation. (A) RyR1 alternative splicing of fetal ASII(−) and ASII(+) isoforms and schematic representation of the ASII splicing isoforms of RyR1. (B) Quantification of RyR ASII(−) as compared to the total transcript. (C) SERCA1 alternative splicing of fetal SERCA1b and adult SERCA1a isoforms and schematic representation of the SERCA1 splicing isoforms. (D) Quantification of fetal SERCA1b as compared to the total transcript. (E) Cav1.1 alternative splicing of fetal Cav1.1Δ29 and adult Cav1.1 isoforms and schematic representation of the Cav1.1 splicing isoforms. (F) Quantification of fetal Cav1.1 Δ29 as compared to the total transcript. PCR products were separated in 3% agarose gel by electrophoresis. Data are the mean ± SD. * p < 0.05, ** p < 0.01 as compared to controls by Students’ t test. The numbers of single lines studied is given in brackets.

