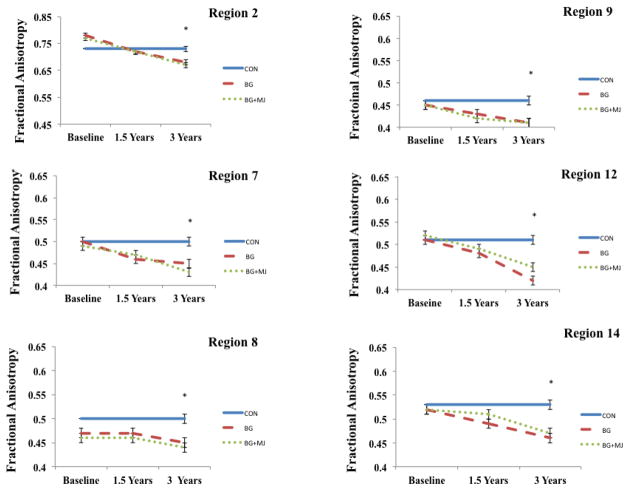
Figure 3.
Selected regions demonstrating between group differences at year 3. Repeated measures ANOVA performed within user groups only at all three time points. Controls not included in repeated measures analysis, FA values from 3-year follow-up represented at each time point for controls and included in figure as reference point only.
* p < 0.01, corrected, between group differences at 3-year follow-up

