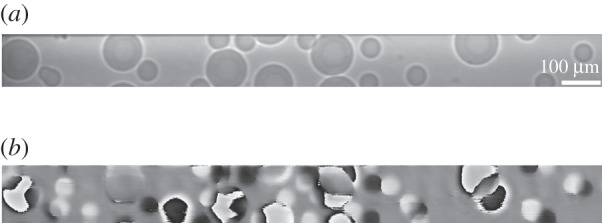
Figure 4.

In this example, the sample consists of a distribution of polystyrene spheres. Image (a) is a direct projection. Edge enhancement is due to Fresnel diffraction over the distance between the sample and the camera. Image (b) is the phase image acquired by the gBH interferometer. The phase value of each bead can be positive or negative, depending on in which of the two interfering beams was it located. Also can be seen are overlapping phase images of two beads of opposite phases. These are from beads that were physically in separate beams.
