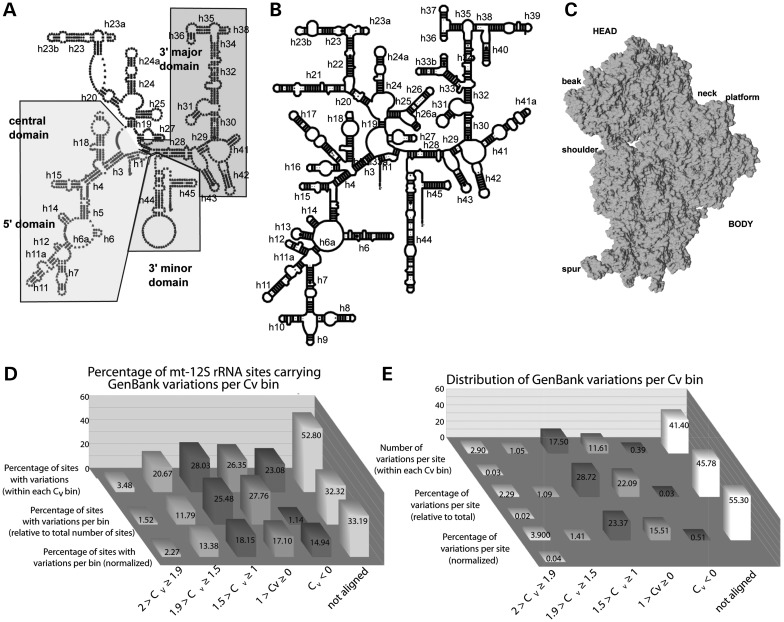
Figure 1.
(A and B) SSU secondary-structure maps. The secondary-structure map of the human mt-12S rRNA is shown in (A). Helices numbered according to the E. coli secondary structure model, shown in B. (C) Three-dimensional structure of the E. coli SSU with landmarks indicated. (D) Percentage of mt-12S rRNA positions carrying GenBank variations within each Cv bin. Cv bins were defined as described at the Comparative RNA Web (CRW) Site (25,26). Back row: per-bin percentage of sites with GenBank variations, relative to the total number of residues in each Cv bin. Middle row: per-bin percentage of sites with GenBank variations, relative to the total number of mt-12S rRNA sites with variations present in GenBank. Front row: normalized, per-bin percentage of sites with GenBank variations, relative to the normalized total number of mt-12S rRNA sites with such variations (normalization is to the Cv bin with the highest number of sites, i.e. 1 > Cv ≥ 0; the normalized values used for these calculations are shown in Table 1). X axis: Cv bins. Y axis: percentage value. (E) Distribution of mt-12S rRNA GenBank variations per Cv bin. The distribution is shown as the number of GenBank variations per site within each Cv bin (two back rows, see main text for calculation details); as the per-bin percentage of variations, relative to the total number of mt-12S rRNA variations present in GenBank (two middle rows); and as the per-bin, normalized percentage of variations, relative to the normalized total number of mt-12S rRNA variations with such variations (normalization as in D). Odd rows: as adjacent even row but corrected after discarding the outlier residue 180A (m.827A) (see main text. Only shown for most conserved bin). X axis: Cv bins. Y axis: number of variations per site (two back rows), percentage value (four front rows).

