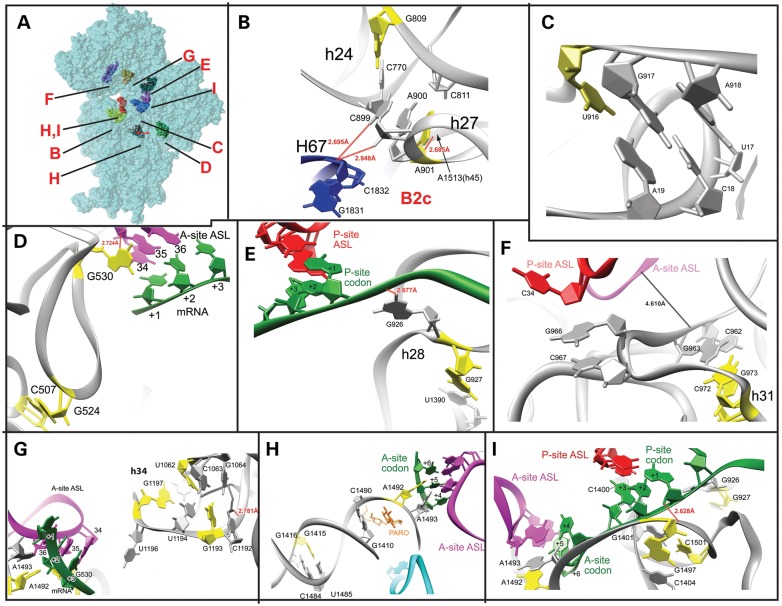
Figure 5.
Placement of mitochondrial mutations in the structures of bacterial SSUs. (A) Surface representation of the E. coli SSU showing the location of the residues shown in B–I. (B) 530 pseudoknot. RCSB accession code 2J00. (C) Central pseudoknot. RCSB accession code 2I2P. (D) Bridge b-B2c. RCSB accession codes 2I2P and 2I2T. (E) 927 region. RCSB accession code 2J02. (F) 972 region. RCSB accession code 2J02. (G) Mutations in b-h34 and A-site codon–anticodon interaction. RCSB accession code 2J00. (H) b-h44. The aminoglycoside antibiotic paromomycin is shown in orange. RCSB accession code 2J00. (I) Decoding region of b-h44. RCSB accession code 2J00. (B–I) Bacterial equivalents of mitochondrial mutations shown in yellow. Other residues mentioned in the main text are shown in gray. 16S rRNA shown in gray. P-site ASL in red, A-site ASL in purple, mRNA in green, ribosomal proteins in black and 23S rRNA in blue. Inter-atomic distances are indicated, but note that ribbon representations do not necessarily reflect accurate interatomic distances involving backbone atoms.

