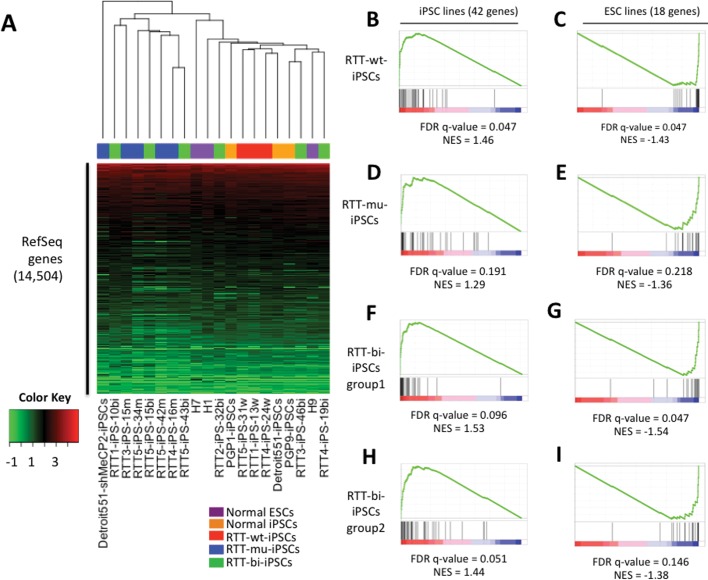
Figure 1.
Global Expression similarity of hESCs, cell line-derived iPSCs and RTT-iPSCs. (A) Supervised hierarchical clustering analysis was performed using 14 504 expressed RefSeq genes. Log2(FPKM) values were represented by colors from green (low) to red (high). (B–I) Enrichment of iPSCs and hESCs-specific genes in RTT-iPSCs. False discovery rate (FDR) and normalized enrichment score (NES) were calculated by Gene Set Enrichment Analysis (GSEA) software at Broad institute.

