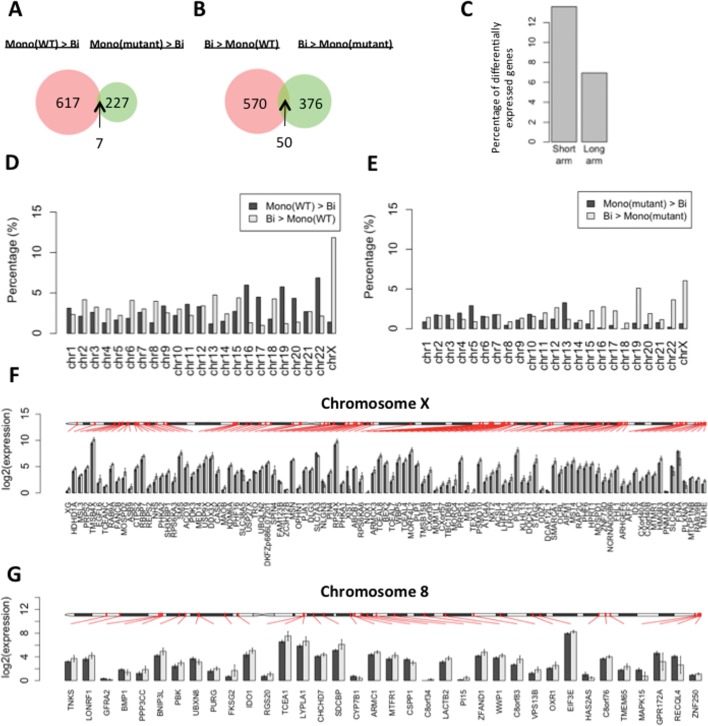
Figure 3.
Differentially expressed genes between monoallelic and biallelic RTT-iPSCs. (A and B) Venn diagram represents the number of (A) highly or (B) lowly expressed genes in RTT-wt-iPSCs and RTT-mu-iPSCs compared with RTT-bi-iPSCs (P < 0.05). Thus, the common genes in (A) were defined as monoallelic iPSC-specific and in (B) as biallelic iPSC-specific genes. (C) Comparison of the ratio of differentially expressed X-linked genes between short (<60 600 kbp) and long arms (>60 600 kbp). (D and E) (D) The percentage of differentially expressed genes in each chromosome between RTT-wt-iPSCs and RTT-bi-iPSCs and (E) between RTT-mu-iPSCs and RTT-bi-iPSCs. The ratio was calculated by dividing the absolute amount of differentially expressed genes by the total number of genes per chromosome. (F and G) Chromosomal distribution of differentially-expressed genes in (F) chromosome X and (G) chromosome 8. Black and gray bars represent average of log2(FPKM) value in RTT-wt-iPSCs and RTT-bi-iPSCs, respectively. Error bar represents standard deviation of log2(FPKM).

