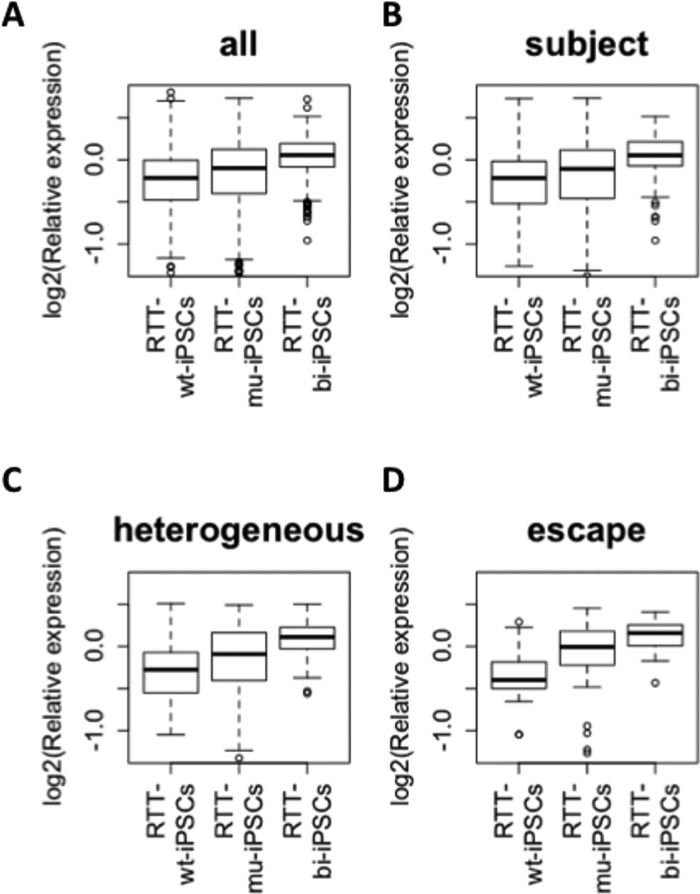
Figure 4.
Expression of genes in X chromosome among mono-allelic wild type and mutant, and biallelic RTT-iPSCs. Relative expression level to average of all RTT-iPSCs are shown (log2 scale): (A) average all; (B), ‘heterogeneous’; (C), ‘subject’; (D), ‘escape’ X-linked genes which are defined by Carrel et al. (38).

