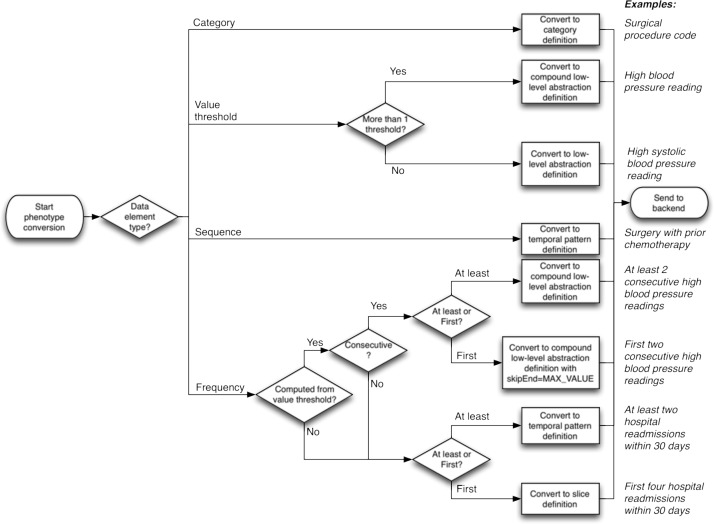
Figure 7:
Flow chart showing the process of converting Eureka! data elements into temporal abstraction definitions. This occurs in the services layer (Phenotypes component in Figure 1). Example phenotypes and how they would go through this workflow are illustrated on the right.

