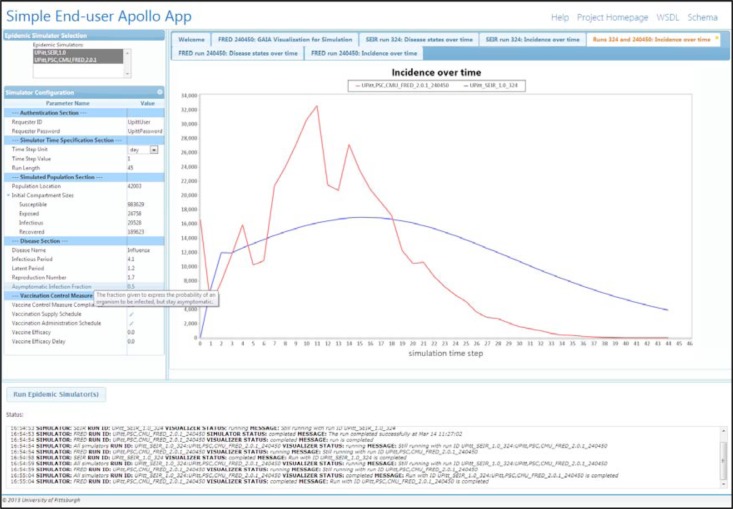
Figure 7.
A simple end-user application using the Apollo Web Services to run the same simulation on two epidemic simulators. The user, having hovered the mouse over the term “Asymptomatic Infection Fraction,” sees a definition of the term obtained directly from the Apollo-SV OWL file. The status area at bottom left reports the progress of simulators and other components. The incidence plot (right) was created by the Time-Series Visualizer service, an implementation of a Visualizer Service.

