
Figure 4:
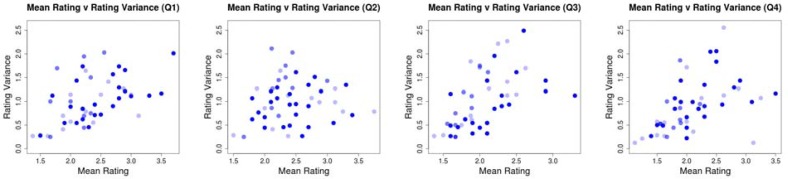
Scatter plots showing the mean rating for a message against the rating variance for that message. Each plot shows the means and variances calculated for a different question. The opacity of the points is scaled by the number of observed ratings for that message. In this case, the maximum number of ratings observed for a message was 10 and the minimum was 8.