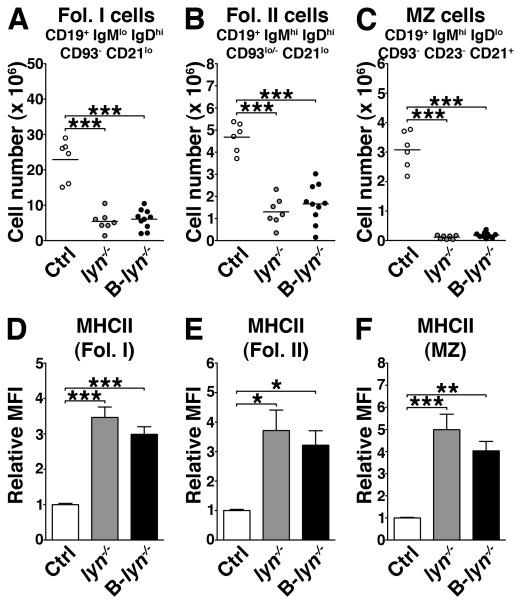
Figure 2. Lyn is required for the development of mature B cells.
(A-C) Absolute numbers of follicular I (Fol. I, A), follicular II (Fol. II, B) and marginal zone (MZ) B cells (C) in the spleens of 8 month-old control, lyn−/− and B-lyn−/− mice. Data represent mean of independent experiments. Each dot represents an individual mouse.
(D-F) MFI (relative to control) of MHCII expressed by Fol. I (D), Fol. II (E) and MZ (F) B cells in the spleens of 8 month-old mice. Bars represent mean ± SEM of independent experiments from 6-10 mice per group.
(A-F) * P ≤ 0.05, ** P ≤ 0.01, *** P ≤ 0.001 (One-way ANOVA).

