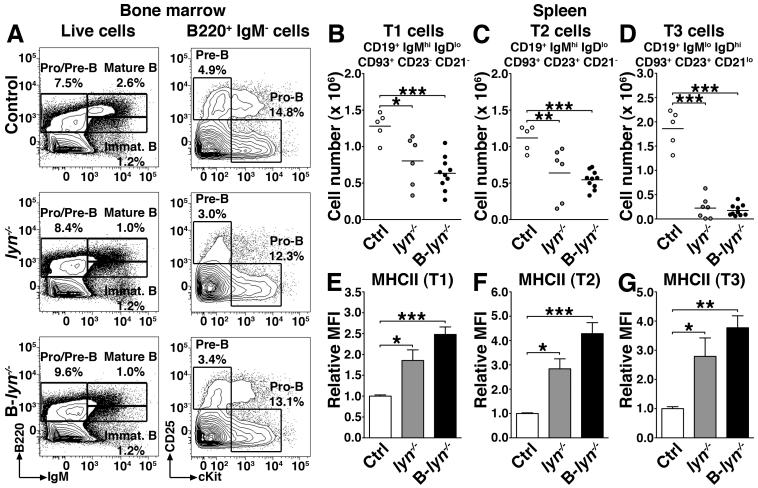
Figure 3. B cell intrinsic loss of Lyn leads to reduction in splenic T1, T2 and T3 cells.
(A) Representative contour plots showing the percentages of Pro/Pre-B and mature/immature B cells in the bone marrow of 2 month-old control, lyn−/− and B-lyn−/− mice.
(B-D) Absolute numbers of transitional T1 (B), T2 (C) and T3 (D) B cells in the spleens of 2 month-old control, lyn−/− and B-lyn−/− mice. Data represent mean of independent experiments. Each dot represents an individual mouse.
(E-G) MFI (relative to control) of MHCII expressed by transitional T1 (E), T2 (F) and T3 (G) B cells in the spleens of 2 month-old mice. Bars represent mean ± SEM of independent experiments from 5-10 mice per group.
(B-G) * P ≤ 0.05, ** P ≤ 0.01, *** P ≤ 0.001 (One-way ANOVA).

