
Figure 2.
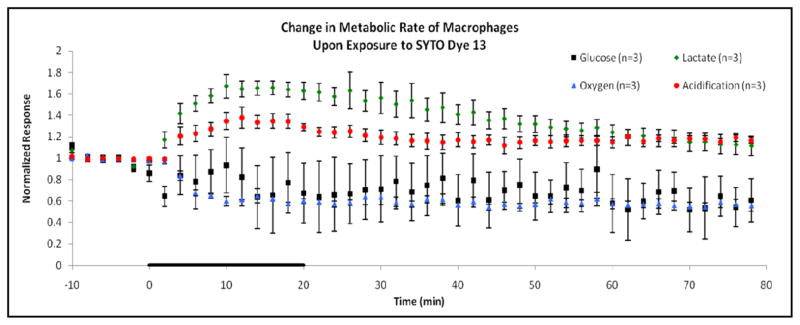
Normalized metabolic responses for 0.5 μL dye/mL SYTO dye 13 exposure to macrophage (RAW 264.7) cells. Basal baseline measurements were obtained 10 min prior to exposure, with standard error variation in the baseline follows: glucose ± 3.70%, lactate ± 1.50%, oxygen ± 0.34%, and acidification ± 0.11%. The cells were exposed to SYTO dye for 20 min, as indicated by the black line on the horizontal axis of the graph. Afterwards, running media was applied for a 60 min recovery period. Again, significant increases in anaerobic respiration and decreases in aerobic respiration suggest a metabolic shift in ATP production brought on by the cellular exposure to SYTO dye.