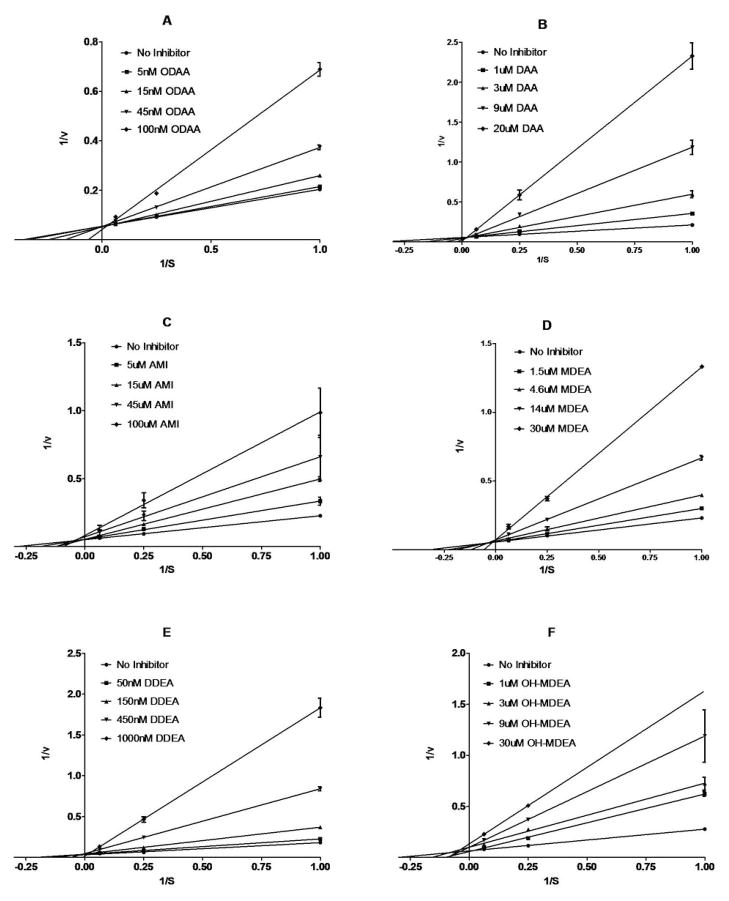
Figure 4.
Lineweaver-Burke (L-B) reciprocal plots of the velocity of formation of (S)-7-hydroxywarfarin vs. (S)-warfarin concentration (1, 4 and 16 μM) in the presence of fixed concentrations of A) ODAA, B) DAA, C) AMIO, D) MDEA, E) DDEA or F) 3′-OHMDEA in incubations with HLM at 0.25 mg/mL microsomal protein concentration. Ki’s of 0.032 ± 0.006, 2.0 ± 0.3, 39 ± 14, 5.9 ± 0.9, 0.053 ± 0.008 and 5.2 ± 2.0 μM were determined for A–F, respectively, from replotting the data as the inverse of the velocity of formation of (S)-7-hydroxywarfarin vs. inhibitor concentration (Dixon plots not shown). Data points are mean values derived from triplicate incubations with standard deviations denoted by error bars.

