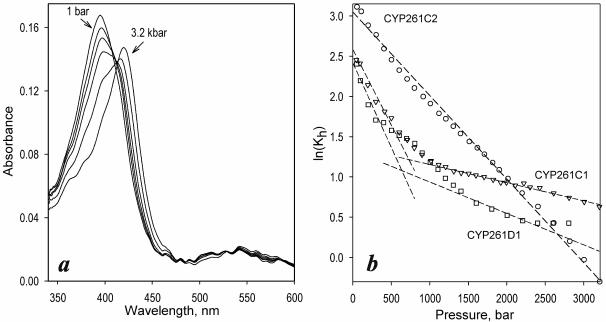
Figure 1.
Effect of hydrostatic pressure on CYP261 proteins. (a) a series of spectra of absorbance of CYP261C2 measured at the pressures of 1 bar and 1, 1.4, 1.6, 1.8, 2.4 and 3.2 kbar. (b): Pressure dependencies of ln(Kh) for CYP261C1 (triangles), CYP261D1 (circles) and CYP261D1 (squares). Dashed lines show linear approximations of the initial and final parts of the plots.

