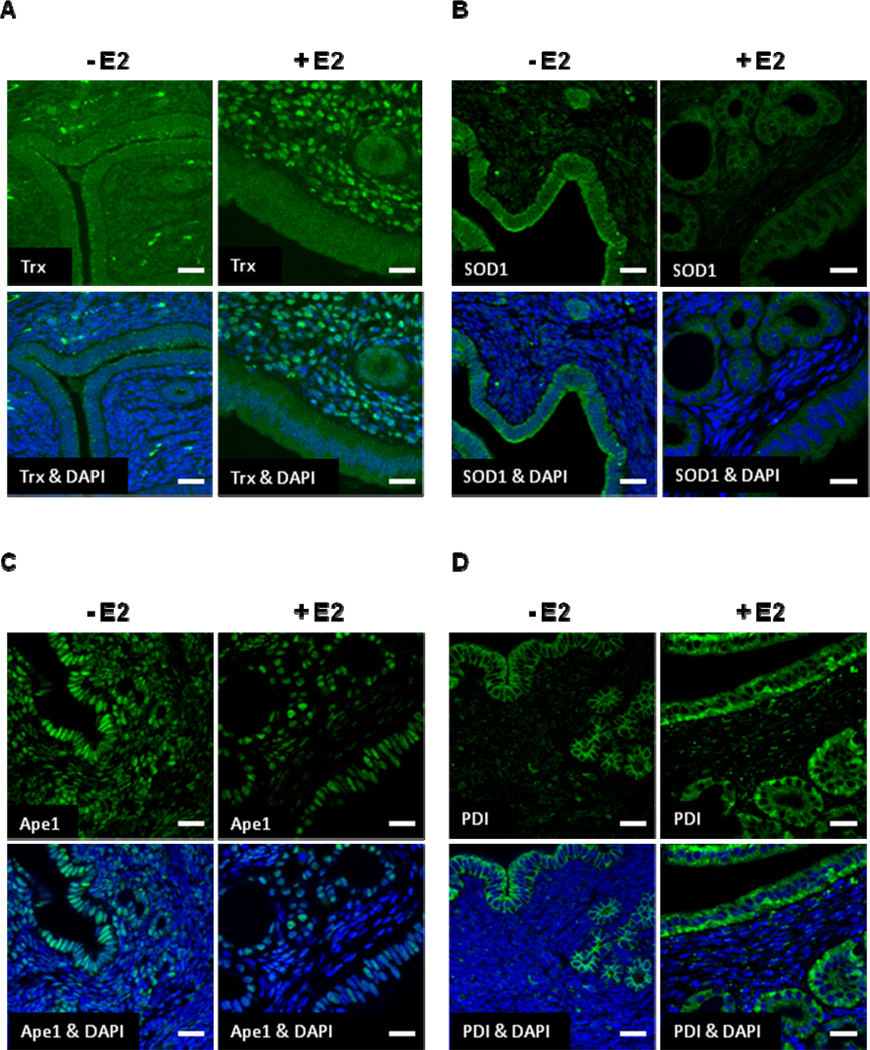
Fig. 4. E2 Influences Trx, SOD1, Ape1, and PDI protein expression in uterine epithelial and stromal cells.
Ovariectomized female mice were treated with oil or E2 for 7 days and (A) Trx, (B) SOD1, (C) Ape1, and (D) PDI expression was examined in uterine sections using immunofluorescent microscopy. DAPI counter staining was included to identify cell nuclei. Scale bars indicate 25 µm. Six mice were included in the oil- and E2-treated groups. Representative images are shown.

