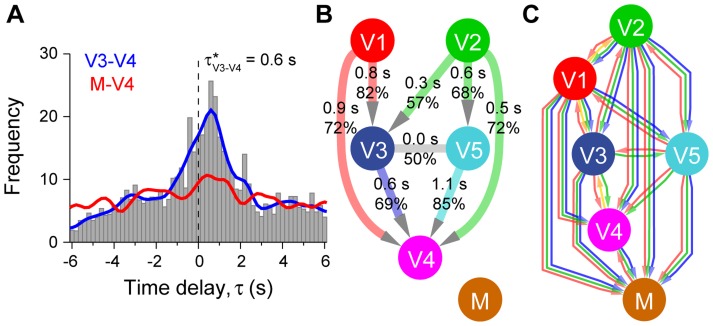
Figure 2. Directional correlations between tracks of dog pairs, the resulting leadership network and the results of the dominance questionnaire.
(A) Directional correlation delay time (τ) values for a given pair (V3 and V4) when high correlation was found for a time window shown by the grey histogram, while the blue curve shows the function gained by Gaussian smoothing with σ = 0.3 s. The distribution shows a clear peak at τ* = 0.6 s. For a comparison, the red curve shows a directional correlation delay time function for another pair (M and V4), where no connection was found between the two dogs in the absence of a significant peak. (B) Summarised leadership network composed of the directional delay time values. Each directed link points from the individual that plays the role of the leader more often in the given relationship toward the follower. The grey link shows a strong connection between V3 and V5 with an evenly matched relationship (τ* = 0 s). The upper values on the edges indicate the mode of time delays in seconds and the lower values show the average portion that the leader of that pair was actually leading. Note that these modes are from wide distributions (as shown on panel A) with an average full width at half maximum of 3.7 s. The mixed-breed (M) is not connected to any Vizslas, and so is not part of the network. This network is used to calculate leading tendency, which is the number of followers that can be reached travelling through directed links. (C) Dominance network between the dogs derived from the dominance questionnaire [29]. Each directed edge points from the dominant individual toward the subordinate one. The colours represent the context when dominance is evident: red: barking, orange: licking the mouth, green: eating and blue: fighting (see more details in Text S1). The nodes were arranged in the vertical direction in such a way that more edges point downwards than upwards between all pairs.

