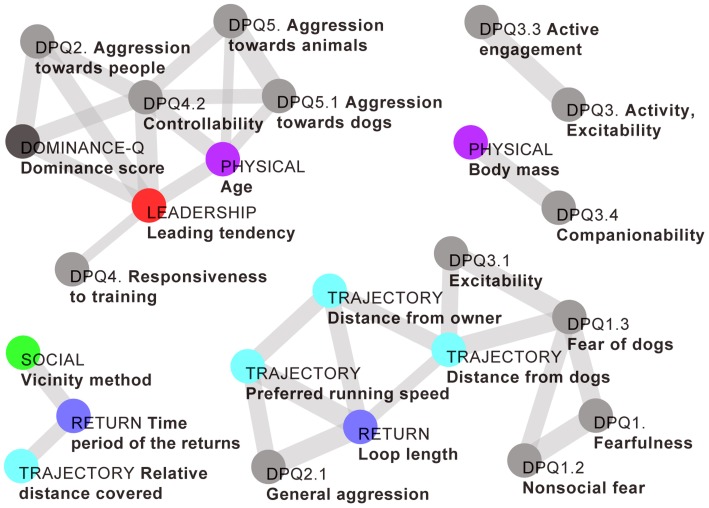
Figure 3. Significant correlations of variables calculated from trajectory data with the personality traits of the dogs measured by questionnaires.
The figure shows the significant correlations (where p<0.05) between the variables (edge width indicating the strength of correlation) calculated for the Vizslas (n = 5). The first term of each name and the colouring of the nodes show the origin of each variable: DPQ: Dog Personality Questionnaire ([51]; gray), Dominance-Q: dominance questionnaire ([29]; dark gray); Physical: physical attributes of the dogs (purple); Trajectory: simple characteristics from the trajectories (cyan); Return: relevant characteristics of the returns to the owner (blue); Social: number of social connection to other dogs calculated from trajectories (green); Leadership: leadership hierarchy from directional correlation delays (red). Only those questionnaire variables are shown which had significant correlation with any variable of another type. All connections are shown between the variables presented on the plot.

