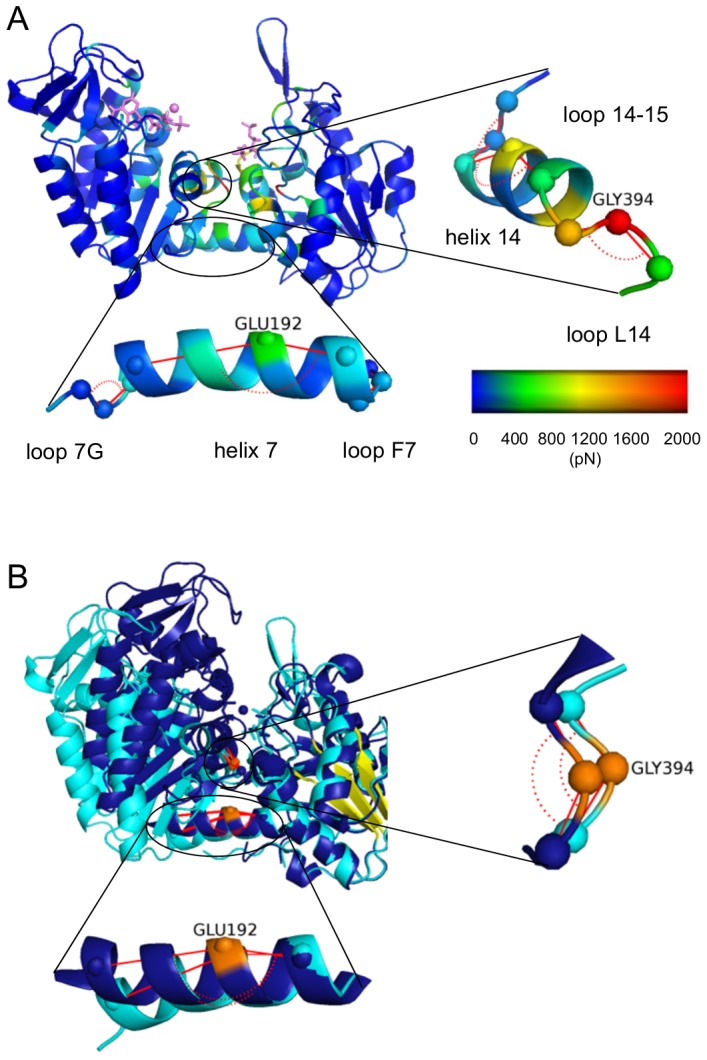
Figure 3. Bending residues of hPGK.

(A) Color coded representation of atomic punctual stresses between apo and complex hPGK. Colors range from blue (minimum value) to red (maximum value). BPG and ADP are denoted by purple sticks, the Mg-ion by a purple sphere. Right: enlarged view of the interdomain region formed by helix 14 and loops L14, 14–15. Spheres show Cα atoms between which the bending angles (denoted by red lines) were calculated (Table 1). Bottom: enlarged view of interdomain region formed by helix 7 and loops F7, 7G. Spheres show Cα atoms between which the bending angles (denoted by red lines) were calculated. (B) Open (cyan) and closed (blue) X-ray structure of hPGK superimposed to the N-domain β-core (yellow). ADP and BPG are marked by sticks, the Mg-ion by a sphere. Enlarged views of the interdomain regions of loop L14 and helix 7. Orange spheres indicate the hinge points.
