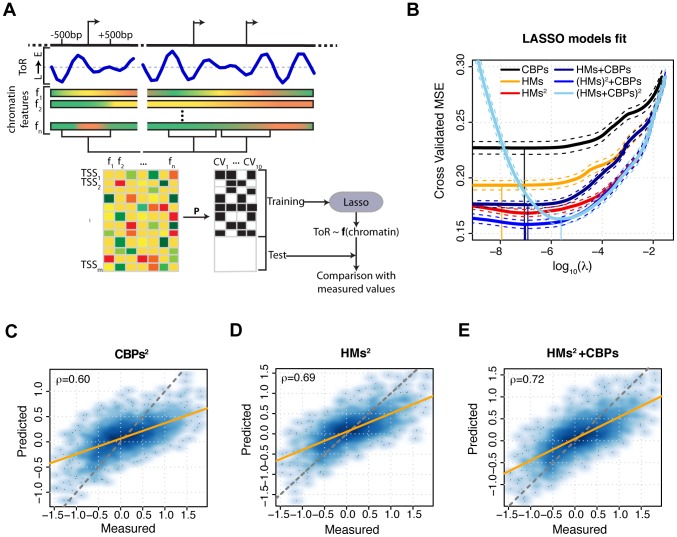
Figure 1. Schematic representation of the modeling framework and combinatorial predictive power of chromatin features.
(A) Schematic illustration of the modeling framework. DNA replication timing (ToR, blue line) and chromatin feature signals ( indicated by gradient filled rectangles) were quantified for each promoter in a 1 kb window centered on its TSS (
 ). The resulting input data matrix is shown (bottom left), where feature levels are encoded by different colors ranging from dark green to red. TSSs were then randomized according to a permutation P and split in training and test sets. The training set is used to train a Lasso model using 10-fold cross validation. At each model fit (CV1 to CV10), a TSS can either be assigned to the training set (black square) or to the test set (white square). The model was then used to infer the replication timing of promoters in the test set and the model accuracy is evaluated with respect to their experimentally measured replication timing. (B) Cross-validated mean squared error (CV-MSE) as a function of the regularization parameter (log10(λ)) for different Lasso models trained with ten fold cross-validation. The average CV-MSE is reported as solid line, with minimum and maximum CV-MSE drawn as dashed lines. A vertical line reaching a CV-MSE curve indicates the value of λ that was used to generate predictions from the corresponding model. The different sets of features used for model training are indicated in the legend. (C–E) Predicted versus experimentally measured replication timing of the test set represented as smoothed color density scatter plot. Model predictions were generated using second-order interactions between CBPs (CBPs2, C), HMs (HMs2, D) and HMs2+CBPs (E). Prediction accuracies are Pearson correlation coefficients. Orange lines indicate the model fit, whereas dashed gray lines indicate the bisector
  .
.

