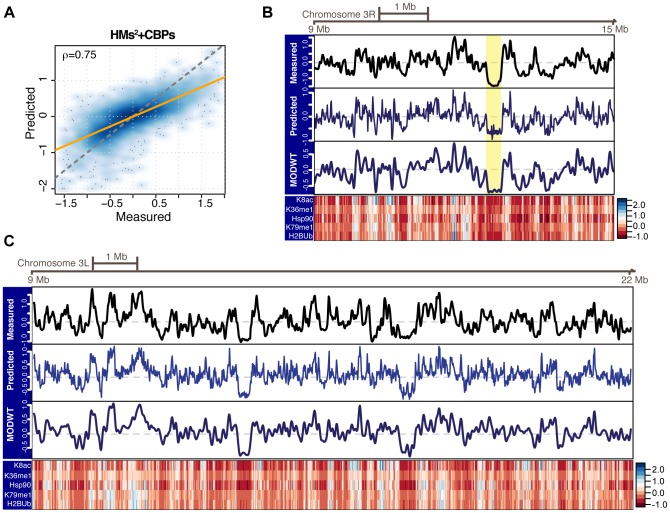
Figure 3. Predicting the replication timing profile of the Drosophila S2 cells genome.
(A) Predicted versus experimentally measured replication timing of the Drosophila S2 cells genome represented as smoothed color density scatter plot. Model predictions were generated using the Lasso model based on CBPs and second-order interactions between HMs (HMs2+CBPs) and trained at promoters. Prediction accuracy is Pearson correlation coefficient. The orange line indicates the model fit, whereas the dashed gray line indicates the bisector  . (B,C) Measured (top track) and predicted (middle and bottom track, see Methods) replication timing profiles along 6 Mb and 12 Mb of chromosomes 3R (B) and 3L (C), respectively. A color gradient representation of feature signals is shown at the bottom for chromatin features within the bootstrap-Lasso simplified model (K8ac = H4K8ac; K36me1 = H3K36me1 and K79me1 = H3K79me1). The yellow rectangle in B highlights the genomic position of the Bithorax Complex.

