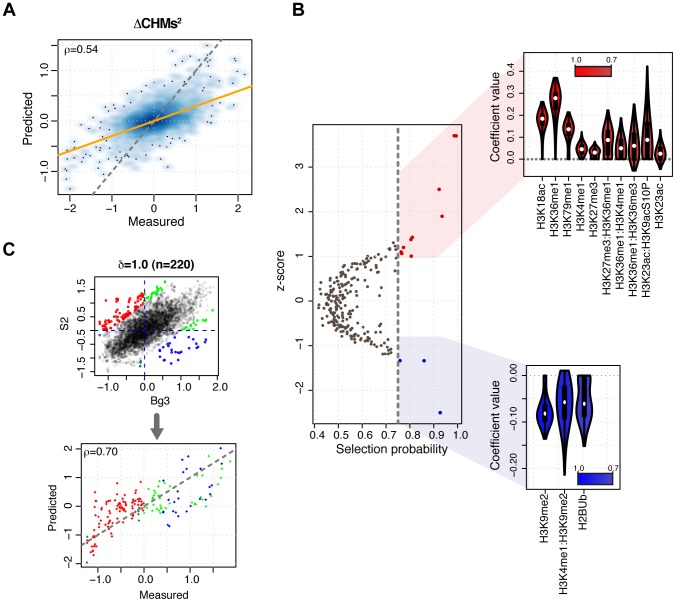
Figure 4. Histone modification levels predict replication timing across different cell types.
(A) Predicted versus experimentally measured differences in replication timing between S2 and Bg3 cells unique promoters (S2-Bg3) represented as smoothed color density scatter plot. Model predictions were generated using differences in HMs levels and their pairwise interactions for a subset of HMs that were profiled in both S2 and Bg3 cell lines (CHMs). The orange line indicates the model fit, whereas the dashed gray line indicates the bisector  . (B) Scatter plot of model features according to their z-scores and bootstrap-Lasso selection probabilities (p). Features with
  are colored in red (positive coefficient values) or blue (negative coefficient values) and their coefficient distributions are shown on the right as violin plots. Features are ranked by decreasing selection probabilities. (C, top) Replication timing of S2 cells promoters versus Bg3. Differentially replicating promoters are color-coded according to the quadrant (delimited by dashed blue lines) they belong to (red: early replicating in S2 and late replicating in Bg3; green: early in both S2 and Bg3; blue: late in S2 and early in Bg3, aqua: late in both S2 and Bg3). A total of
  promoters exhibit a log fold change greater than or equal to 1 (
 ). (C, bottom) Experimentally determined replication timing in Bg3 versus predictions generated by a model based on pairwise interactions between CHMs in S2 cells. Prediction accuracy is Pearson correlation coefficient. The dashed gray line indicates the bisector
  .
.

