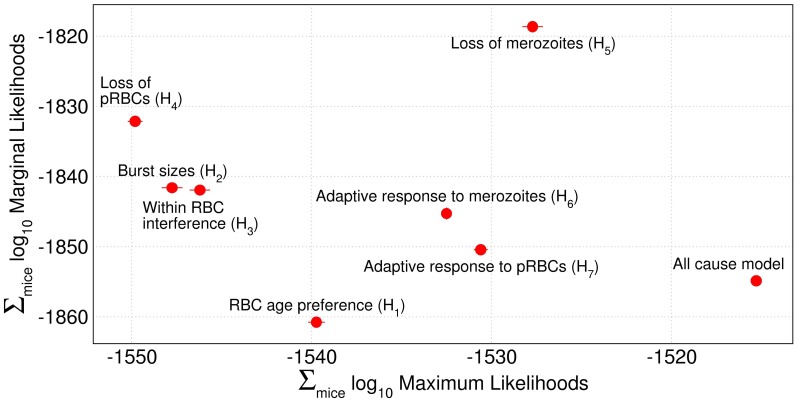
Figure 2. Statistical comparison of possible causes of competition.
Marginal against maximum likelihoods on a  scale of the all-cause model and all single-cause models. See Table 1. As all mice are independent, the marginal and maximum likelihoods of a model are summed over all mice in all treatment groups. Competitive suppression of the AS clone by the AJ clone can be solely explained by differences in the parameter
  (Hypothesis H5). No other single cause of competition adequately predicts the data. Circles show mean, and error bars show 2 standard errors from 5 independent fits.

