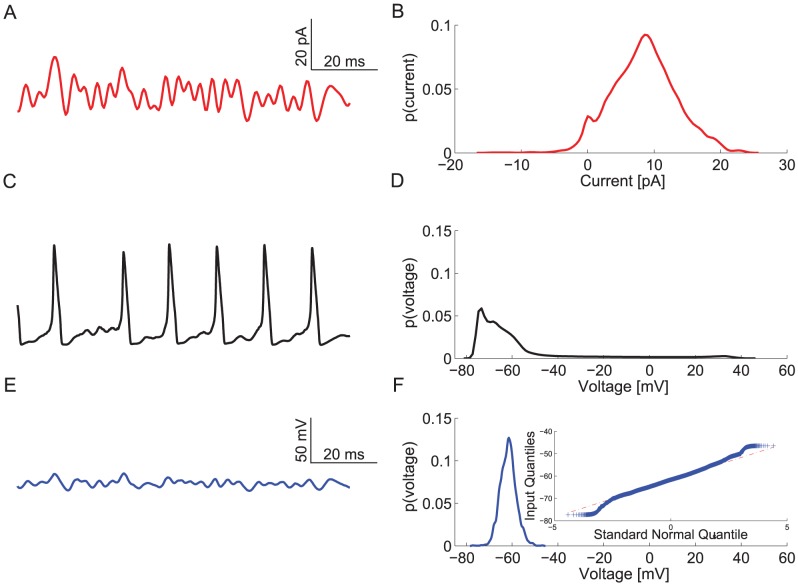
Figure 1. Voltage responses of spiking and graded potentials.
A. The band-limited 300 Hz filtered Gaussian white noise current stimulus. B. The probably density function (PDF) of the current stimulus shown in A. C. A voltage response of the spiking neuron model to the current stimulus shown in A. D. The PDF of the spiking neuron model's voltage response. E. A voltage response of the graded neuron model to the current stimulus shown in A. F. The PDF of the graded neuron model's voltage response. (Inset) A QQ plot showing departures from a Gaussian distribution (dotted red-line) for the time-series shown in E.

