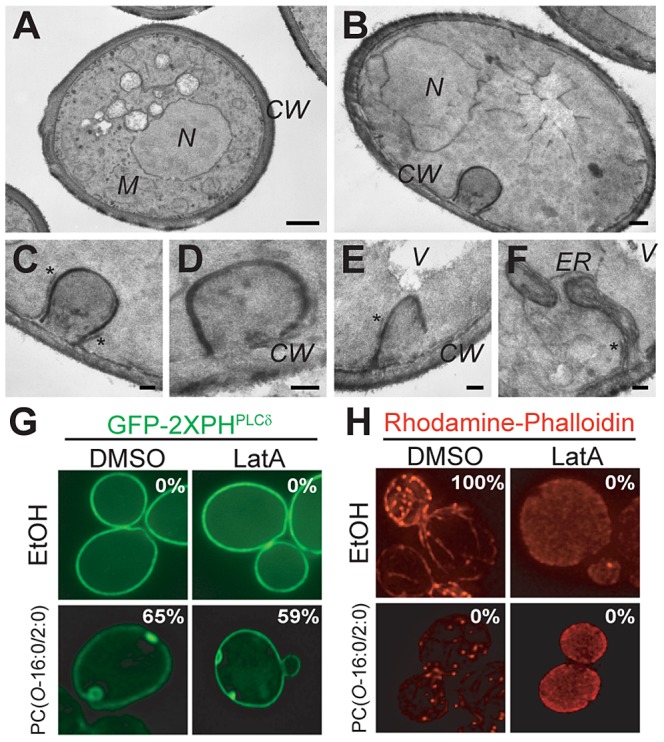
Figure 3. Characterization of PM changes in PC(O-16:0/2:0)-treated cells.

Large PM invaginations are present in PC( O -16:0/2:0)-treated cells. Wild type cells (BY4742) exposed (B, C, D, E and F) or not (A) to PC(O-16:0/2:0) for 15 min were processed for EM as previously described [55]. Panel (C) is an inset of panel (B). Panels (D), (E) and (F) show magnifications of the large PM invaginations induced by PC(O-16:0/2:0), which very likely represent the PES. The asterisks indicate the peripheral ER that is associated with the PM. CW, cell wall; ER, endoplasmic reticulum; M, mitochondrion; V, vacuole. Bars in panels (A) and (B), 500 µm; bars in panels (C), (D), (E) and (F), 100 µm. PES formation still occurs in the presence of depolymerised actin. (G) Wild type cells (YPH500) expressing GFP-2×PHPLCδ were treated with Latrunculin A (5 µM, 30 min) to induce depolymerization of the actin cytoskeleton prior to treatment with PC(O-16:0/2:0) (20 µM, 15 min) and imaged live. The percentage of cells displaying a redistribution of the fluorescent reporter is reported in the inset of the figure. (H) An aliquot of cells was also fixed following treatment for imaging of the actin cytoskeleton by staining with Rhodamine-conjugated phalloidin. The percentage of small budded cells displaying a polarized actin cytoskeleton is reported in the inset of the figure.
