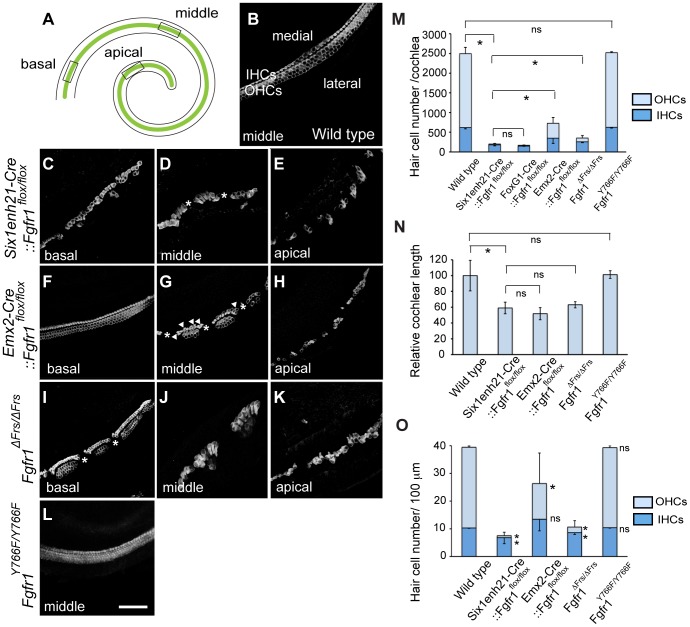
Figure 3. Cochlear hair cells are reduced in Fgfr1 mutants.
(A) Schematic of whole mount view of neonatal cochlear duct. HCs are arranged along the entire length of cochlear duct. (B) Magnified view of wild type cochlear duct labeled with anti-Myo7a antibody. Highly ordered array of three rows of OHCs and one row of IHCs are observed. (C–E) HCs are disrupted in Six1enh21-Cre::Fgfr1flox/flox cochlea. Basally, few OHCs are visible (C). In the middle, there are small gaps in the remaining IHCs (asterix) (D). Apically, sparsely distributed HCs are observed (E). (F–H) Emx2-Cre::Fgfr1flox/flox mice show a less severe phenotype. Basally, IHCs and OHCs form, although only two rows of OHCs form (F). In the middle region, islands of HCs form between gaps (asterix). Additional IHCs are occasionally observed (arrowheads) (G). Apically, islands are sparse (H). (I–K) Fgfr1 ΔFrs/ΔFrs cochlea shows a less severe phenotype than that of Six1enh21-Cre::Fgfr1flox/flox cochlea, but more severe phenotype than Emx2-Cre::Fgfr1flox/flox cochlea. Basally, some IHCs and OHCs form, although frequently arranged in islands, punctuated by gaps (asterix). (L) The number of rows of HCs and their patterning are unaffected in Fgfr1Y766F/Y766F mutant cochlea. (M) Stacked graph comparing the number of cochlear IHCs and OHCs amongst different Fgfr1 mutants. Sum of each number represents total HC number. Statistic significance is shown for total HC number. Error bars (mean ± SD) represent variation in each HC type. (N) Graph showing relative length of cochlear duct at E18.5. Cochlear length is decreased by approximately 40–50% in all Fgfr1 mutants except Fgfr1Y766F/Y766F. (O) Number of IHCs and OHCs are counted and normalized to 100 µm from different Fgfr1 mutants. Sum of each number represents total HC number per 100 µm. Statistic significance is shown for each HC type, compared with the number of HCs from wild type. Error bars (mean ± SD) represent variation in each HC type. *p<0.05. ns, not significant. Scale bar: C–L; 50 µm (in L).

