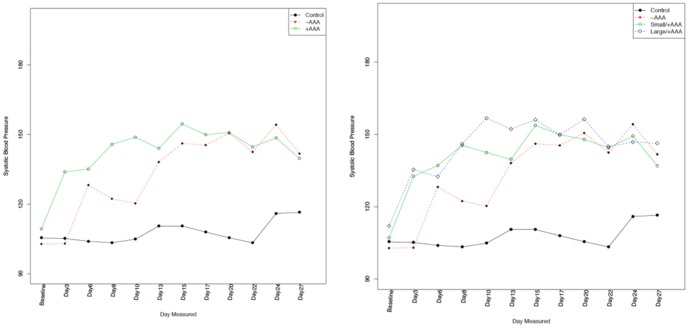
Figure 3. Systemic Hemodynamics and AAA development.
Left panel, serial hemodynamic assessment (n = 59) demonstrates an increase in systolic blood pressure following Ang II infusion, which plateaued in the second week of infusion. However, among mice exposed to Ang II there were no differences in systolic blood pressure between those that developed AAA and those that did not. Right panel, similar systolic blood pressure pattern was noted independent of the size of AAA. Overall, statistical comparison revealed no significant difference in all hemodynamic parameters between mice that developed AAA versus those that did not; likewise, there was no difference by AAA size.

