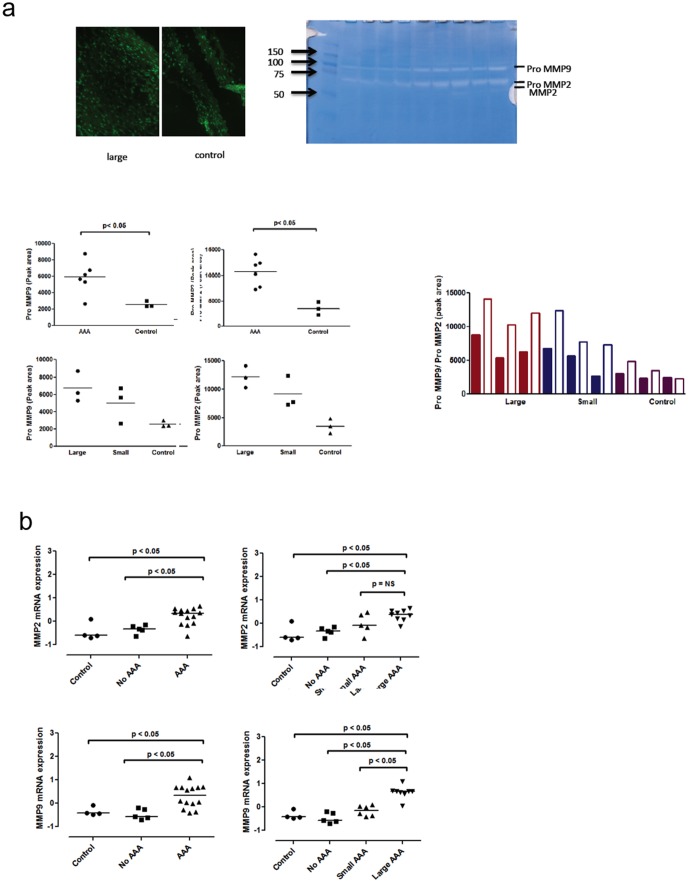
Figure 6. MMP expression in AAA.
(A)Top left) In situ zymography shows an increase in gelatin degrading enzymes (MMPs) in large AAA versus control (data for small AAA was similar; data not shown). Top right) Zymography of tissue from both AAA and control aorta revealed the presence of pro-MMP9 and pro MMP2 (and to a minimal extent MMP2). Graphs demonstrate significant differences in peak area analysis between AAA and control. Differences between large and small AAA were not significant but do show a clear trend of increased activity of pro MMP's in large versus small AAA (control n = 3, small AAA n = 3 and large AAA n = 3). (B) Analysis of MMP2 (control n = 4, no AAA n = 5, small AAA n = 5 and large AAA n = 9) and MMP9 (control n = 4, no AAA n = 5, small AAA n = 6 and large AAA n = 8) gene expression demonstrated increased expression of MMPs according the presence of AAA. However, only MMP9 showed increased expression according AAA size.

