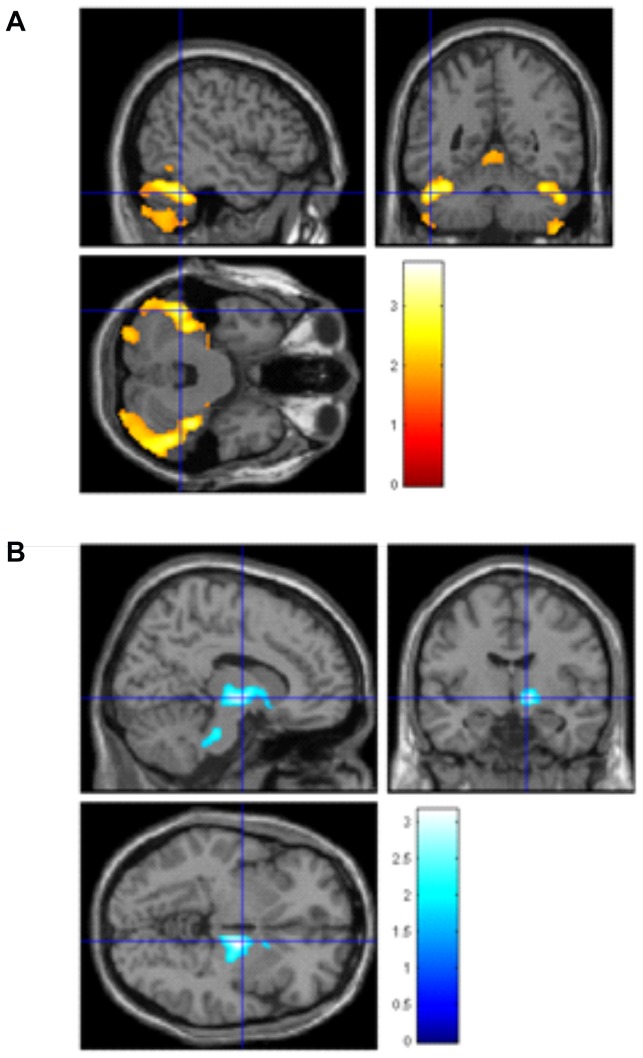
Figure 3. VBM regression analyses in the rs6265 SNP.
Left side: Larger brain volume in the bilateral cerebellum in the AA/AG versus GG allele, x = 58/−45, y = −64/−50, z = −38/−32; Right side: Smaller volume in the right thalamus/brainstem in AA/AG versus GG allele, x = 12, y = −8, z = −4. T bars represent volume difference as T-statistic.

