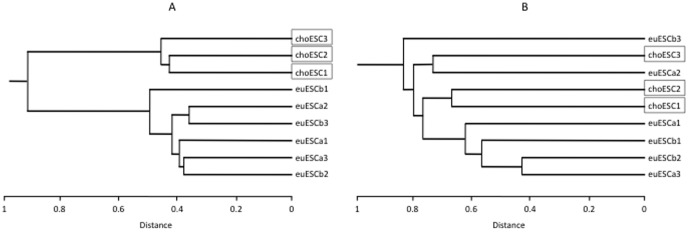
Figure 1. The results of the hierarchical clustering analysis of genome-wide DNA methylation status (A) and the transcriptome analysis (B).

A hierarchical dendrogram showing that the choESC samples cluster according to lineage and were separated from the euESC samples in DNA methylation (A), despite the fact that no cluster formations can be recognized in the transcriptome analysis (B).
