
Figure 2. The results of the principal component analysis of genome-wide DNA methylation status (A) and the transcriptome analysis (B).
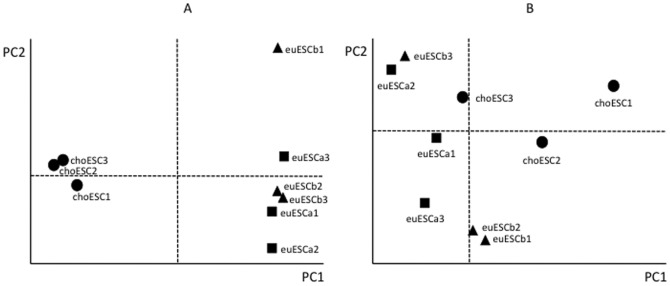
The closed squares, closed triangles and closed circles represent euESCa, euESCb and choESC, respectively. The PC1 axis clearly distinguished the choESC from the euESC, whereas the euESCa and euESCb were identical in DNA methylation (A). No clear clusters were observed in the transcriptome analysis (B).